



Abstract
Background: The present study was carried out to identify potential effects of dexamethasone (DEX) on antioxidant parameters of Acanthopagrus arabicus, in vitro.
Methods: Cultured hepatocytes from A. arabicus were exposed to 3, 3×10, 3×10², and 3×10³ µg/ml of DEX for 48 h. Then, the toxic effects of DEX on the total antioxidant capacity (TAC), glutathione (GSH) enzyme activity, lipid peroxidation (LPO), alanine aminotransferase (ALT), aspartate aminotransferase (AST), and alkaline phosphatase (ALP) were measured at 12, 24, and 48 h of the experiment.
Results: The results indicated that the sensitivity of cultivated liver cells to DEX increased in a dose-dependent manner. The levels of TAC and GSH activity increased significantly in cells exposed to 3 and 3×10 µg/ml of DEX after 48 h of the experiment. In contrast, higher concentrations of DEX (3×10² and 3×10³ µg/ml) induced a significant decrease in TAC value and GSH activity in treated hepatocytes throughout the experiment. The LPO, AST, ALT, and ALP activities increased dose- and time-dependently in cultivated hepatocytes exposed to 3×10² and 3×10³ µg/ml and reached their peak following 48 h of exposure.
Conclusion: DEX can suppress the antioxidant defense system, as evidenced by the significant increase in lipid peroxides and decrease in antioxidant factors in the liver.
Keywords: Acanthopagrus arabicus, Dexamethasone, Glutathione, Liver enzymes, Total antioxidant capacity
Introduction
In recent decades, as medical science has advanced, the production and consumption of pharmaceutical products have increased rapidly. About 3000 pharmaceutical compounds are used worldwide, and their annual production exceeds hundreds of tons [1]. After consumption, pharmaceuticals are excreted in urine and feces as active substances or metabolites. They eventually enter aquatic ecosystems, including freshwater and marine environments, through wastewater influent and effluent. They can even be found in groundwater due to effluent leachates [2]. On the other hand, usually some of the expired or unnecessary drugs are thrown into the sewers. Especially, throwing away these kinds of drugs in hospital effluents that are located near residential areas is a significant issue. For instance, researchers at the University of Buffalo, United States, have found large amounts of antidepressants in the brains of fish that affect fish behavior. Antidepressants reduce the risk-averse behavior of fish, thereby reducing their survival despite catching them [2]. Pharmaceuticals are a new class of pollutants whose negative effects on terrestrial and aquatic environments have received global attention in recent years [2].
Glucocorticoids are steroid hormones widely used in medicine and veterinary medicine, mainly for their anti-inflammatory and immunosuppressive properties. These compounds regulate the hypothalamic-pituitary-adrenal (HPA) axis by affecting the synthesis and secretion of hypothalamic and pituitary hormones [3]. Glucocorticoids are commonly used to treat blood malignancies, particularly acute lymphoblastic leukemia, multiple myeloma, and chronic lymphocytic leukemia. The effectiveness of these drugs depends on their ability to induce the production of reactive oxygen species (ROS), such as superoxide, hydrogen peroxide, and hydroxyl radicals. These products lead to damage and death of cancerous and diseased cells and, at the same time, cause oxidative stress [4]. Oxidative stress leads to severe damage to intracellular compounds, including polyunsaturated fatty acids, lipids, proteins, DNA, and other macromolecules. The result of this damage is the activation of several stress signaling pathways, which ultimately leads to consequences, such as growth arrest, aging, and apoptosis [5].
DEX is the most potent glucocorticoid cortisone derivative, with relatively high levels reported in aquatic ecosystems [5]. Sanchez et al. (2011) measured high concentrations of DEX (10 μg/L) in river water downstream of a French pharmaceutical plant [6]. The use of DEX to treat a wide range of diseases, including allergies, asthma, COVID-19, rheumatic problems, and skin diseases, has led to this glucocorticoid being permanently present in aquatic environments, especially through hospital wastewater [7]. Approximately 0.3 µg/L of DEX has been measured in sewage effluents routinely [8].
Few studies on oxidative stress in fish caused by pharmaceuticals, such as DEX, as aquatic contaminants are available. Studies have shown that many pharmaceuticals in the aquatic environment can alter CYP450 activity and CYP450-mediated pathways in fish, leading to toxicity [9]. The studies conducted on the increase of endogenous glucocorticoids, such as cortisol and its derivatives, have demonstrated that these compounds cause the activation of oxidative processes and the formation of ROS, damage to DNA and the lipid layer of cells and mitochondria, activate the processes of lipid peroxidation (LPO), and reduce antioxidant defense structures [10-11].
Fish are used worldwide as sensitive biological indicators of exposure to aquatic pollutants [12]. Arabian seabream (Acanthopagrus arabicus) was the experimental model used in the present study. This species is a carnivorous fish with a wide distribution in the Persian Gulf and the Oman Sea and is highly consumed by the people of the region [13]. Moreover, this fish has high ecological and commercial importance in the ROPME (Regional Organization for the Protection of the Marine Environment) Sea Area (RSA), and it is therefore considered a suitable indicator [13].
On the other hand, the use of seabream cell lines in toxicological research has been reported worldwide [12]. Since DEX is found in the aquatic environment, the present investigation aimed to; 1. assessed the morphological changes and viability rate of the cultivated hepatocytes derived from the liver of A. arabicus exposed to DEX in vitro; 2. evaluate the toxic effects of DEX on the total antioxidant capacity (TAC), glutathione enzyme activity (GSH) and LPO; 3. measure the toxic effects of DEX on the liver enzymes including alanine aminotransferase (ALT), aspartate aminotransferase (AST), and alkaline phosphatase (ALP).
We hypothesize that: a) exposure of cultivated liver cells from A. arabicus to DEX will manifest through morphological and functional alterations in these cells in vitro; b) DEX exposure, even in the absence of other factors, could produce oxidative stress.
Materials and Methods
Fish collecting and maintenance
A number of 5-8 healthy male and female Arabian seabreams (Acanthopagrus arabicus) with the same size (males: 350±21 mean body weight and 12±3 mean body length; females: 720±45 mean body weight and 28±5 mean body length) were caught from Neishekar creek and transferred alive to the cell culture laboratory. The fish were acclimated for 1 week under natural conditions and fed twice daily [14].
Tissue sampling and cell culture
Liver cell culture was performed based on the method described by Galas and Epler (2002). After anesthetizing the fish with a 2-phenoxyethanol solution (0.2%), the fish were disinfected with 70% ethanol. In aseptic conditions, the fish were dissected, and the liver was separated and placed in phosphate-buffered saline (PBS) (without Ca2+) containing penicillin (100 IU), streptomycin (20 mg/mL), enrofloxacin (10 µg/mL), and amphotericin B (25 µg/mL) for 30 min. This solution has been renewed 3 times. The liver was then divided into small pieces in PBS and digested with PBS containing 0.1% collagenase IV for 20 min at room temperature. Finally, the softened tissues were passed through a 70-micrometer nylon cell sieve (Corning®).
In this way, cellular debris was aspirated, creating a homogeneous cell mixture. All stages of cell separation were monitored using an inverted microscope [15]. The cell suspension was then centrifuged at 200 g for 8 min. After removing the surface medium, Leibovitz’s 15 (L15) culture medium containing 15% bovine serum albumin (FBS), 100 units/ml penicillin, 100 μg/ml streptomycin, 5 mM NaHCO3 and 0.5% ITS (insulin, transferrin, selenium) was added to the cell pellet and centrifuged again. The cells were centrifuged four times at 1000 rpm for 10 min. After the last wash, the cell pellet was resuspended in L-15 medium. Then, a cell count was performed using a hemocytometer and the trypan blue exclusion test. This test is based on the ability of trypan blue dye (Sigma-Aldrich, UK) to penetrate dead cells and change their color to blue. To determine cell viability, 10 µl of trypan blue dye solution (0.1% trypan blue in 0.15 M PBS) was added to 10 µl of the cell suspension, and the number of stained (dead) and unstained (alive) cells was counted. Then the survival percentage was calculated using the following formula [15]:
Percentage of cell survival = Number of dead cells / Total number of counted cells × 100
Cells with more than 90% viability were suspended in L15 culture medium (containing 20% FBS, 100 units/ml penicillin, 100 μg/ml streptomycin, 5 mM NaHCO3, and 0.5% ITS) and plated into 25 cm2 tissue culture flasks at a density of 1×10⁶ cells/ml. The cells were incubated at 27 oC for 14 days. In the meantime, the cells with high density were subcultured. The trypan blue exclusion test was performed to determine the cell viability during the experiment [15].
Evaluation of DEX cytotoxicity
The DEX was dissolved in dimethyl sulphoxide (DMSO) solution, and the solutions were diluted in double-deionized water before use as 3×10⁻² to 3×10⁵ µg/ml.
DEX cytotoxicity was evaluated using the MTT method according to Momeni et al [16]. The MTT test is a colorimetric method based on the reduction of yellow tetrazolium crystals by the mitochondrial succinate dehydrogenase enzyme and the formation of blue insoluble formazan crystals. The more living, metabolically active cells there are, the more intense the blue color is [16].
To prepare MTT with a concentration of 5 mg/ml (as the stock solution), 50 mg of MTT powder was dissolved in 10 ml of 0.15 M PBS. The stock solution was diluted 10-fold with 0.15 M PBS to obtain a 0.5 mg/mL MTT solution.
Briefly, trypsin was added to a 25 cm2 flask to detach the cultivated hepatocytes. The isolated hepatocytes were then moved to 96-well tissue culture microplates (106 cells/well) and incubated overnight at 27°C. The culture medium was then replaced by a fresh L-15 medium with different concentrations of DEX (0[control], 3×10⁻², 3×10⁻¹, 3, 3×10, 3×10², 3×10³, 3×10⁴, and 3×10⁵ µg/ml) and incubated at 27°C for 27 h. After washing the cells twice with PBS, 20 μl of MTT solution was added to each well, and the plates were incubated for 4 h at 27°C. After adding 25 μl of dimethyl sulfoxide (DMSO) to each well, the plates were shaken at 450 rpm for 15 min, then the absorbance was read at 570 nm. According to the MTT results, 3, 3×10, 3×10², and 3×10³µg/ ml were considered as DEX experimental concentrations.
Evaluation of DEX toxic effects
Liver cells were plated in 24-well microplates at a density of 105 cells/ml L-15 medium/well and incubated at 27°C. After 24 h of incubation, 200 μl of fresh L-15 culture medium containing DEX at different concentrations (0[control], 3, 3×10, 3×10², and 3×10³ µg/ml) was added to each well, and the microplates were then incubated at 27°C. Each treatment was run in five replicates. The trypan blue exclusion test was performed to determine cell viability. Samples were taken at 0, 12, 24, and 48 h after cell exposure to DEX. For this purpose, the cells were mechanically scraped from the plates and moved to microtubes for further analysis [16].
Measurement of antioxidant parameters
Thiobarbituric acid reactive substances (TBARS) assay
Liver cell LPO levels were measured using the TBARS assay according to the method described by Devasagayam et al [17]. The amount of malondialdehyde (MDA; a product of LPO) was expressed in terms of TBARS (nmol/g tissue). TBARS was determined fluorometrically by measuring the reaction of MDA with thiobarbituric acid. The product was pink, which absorbed at 532 nm. First, 20 µl of each sample was added to 40 µl of trichloroacetic acid (TCA)–thiobarbituric acid (TBA)–HCl reagent solution (0.37% (w/v) TBA, 15% (w/v) TCA, and 0.25% (w/v) HCl. After heating for 30 min, the solution was cooled in an ice bath and then centrifuged at 1000 g for 10 min. After adding 20 µL of n-butanol, the solution was vigorously shaken, and the optical density (OD) was finally read at 535 nm. The results were reported as nmol TBARS/mg prot.
Total antioxidant capacity (TAC)
The TAC is often used to evaluate antioxidant status and the antioxidant response to free radicals produced under certain conditions. One of the main advantages of this test is that it reports the activity of all antioxidants as a single value, thereby reflecting the cumulative effect of all antioxidants in the biological sample [17]. To assess TAC, the ferric reducing antioxidant power (FRAP) assay was carried out according to Benzie and Strain [17]. In this method, the rate of transformation of 3-valent iron (Ferric) to 2-valent iron (Ferrous) was measured colorimetrically. Briefly, the FRAP reaction mixture contained 2.5 ml of a 10 mmol/l TPTZ (2, 4, 6-tripyridyl-s-triazine; Sigma) solution in 40mmol/l HCl, 2.5ml of20mmol/l FeCl3, and 25 ml of 0.3 mol/l acetate buffer (pH 7.2). The working FRAP reagent (1.5 ml) was mixed with 50 μl of the sample or standard in a test tube. The absorbance was recorded at 593 nm after 10 min at 37°C. 1 mmol/l FeSO4 was used as the standard solution. The result was presented as the concentration of the antioxidant with a ferric-reducing ability equal to that of 1 mmol/L FeSO4. The antioxidant power of each sample was expressed as μM equivalent of FeSO4.
GSH assay
The GSH was measured according to Sedlak and Lindsay (1968). After protein precipitation with 10% trichloroacetic acid, the samples were centrifuged at 10000 g for 10 min at 4°C. Then, 50 μl of supernatant was added to 230 μl of TRIS (0.4 M, pH 8.9) in a microplate, followed by the addition of 20 μl of 2.5 mM DTNB in 25% methanol. Absorbance was determined at 415 nm, GSH concentration was calculated from a standard curve, and activity was expressed as μg/mg protein.
Measurement of ALT, AST, and ALP
The AST enzyme activity was measured colorimetrically using the Pars Azmoun commercial kit according to Reitman and Frankel [19]. The method was based on the conversion of the aspartate amino acid to oxaloacetate by the serum glutamic-oxaloacetic transaminase (SGOT) enzyme. As a result, the addition of a color reagent in an alkaline solution produces a brown complex that can be measured at 505 nm.
The amount of ALT was also measured colorimetrically using the Pars Azmoun commercial kit according to Reitman and Frankel [19]. According to this method, the amino acid alanine is converted to pyruvic acid by the serum glutamic-pyruvic transaminase (SGPT) enzyme, which produces a brown-colored complex when a color reagent is added in an alkaline environment. It is noteworthy that it can be measured at 505 nm.
The ALP enzyme activity was measured spectrophotometrically using the Pars Azmoun commercial kit according to Krogdahl et al [19]. This method was based on the hydrolysis of a substrate solution containing p-nitrophenyl phosphate and buffer by an enzyme in the presence of magnesium, producing a yellow-colored product, p-nitrophenol. The OD was then read at 405 nm.
Statistical analysis
Ten fish were used to obtain sufficient liver cells for this study. Ten cell samples were taken at each concentration to determine the optimal DEX concentration using the MTT test and to assess its cytotoxicity. Five cell samples were used to measure all antioxidant biomarkers.
The data were presented as the means±standard errors of the mean. First, the normality of the data was tested by the Kolmogorov–Smirnov test. The data was then analyzed using SPSS (version 20) software. The differences between treatments were compared using a one-way analysis of variance (ANOVA). A significance level of P<0.05 was accepted.
Results
Primary liver cell culture
In the present study, collagenase IV was used for hepatocyte isolation due to its high ability to separate liver cells while simultaneously supporting cell viability. Cell viability was determined to be 90% based on microscopic observations and quantitative evaluation using the trypan blue exclusion test. The isolated hepatocytes before incubation are shown in Figure 1A. Liver cell adhesion and colony formation began after five days of incubation. Cultured hepatocytes were normally epithelioid in morphology with a multangular or spindle shape under light microscopy (Figure 1B). Liver cells reached about 30% and 90% monolayer confluence on the 9th and 17th days of the experiment (Figure 1B, C).
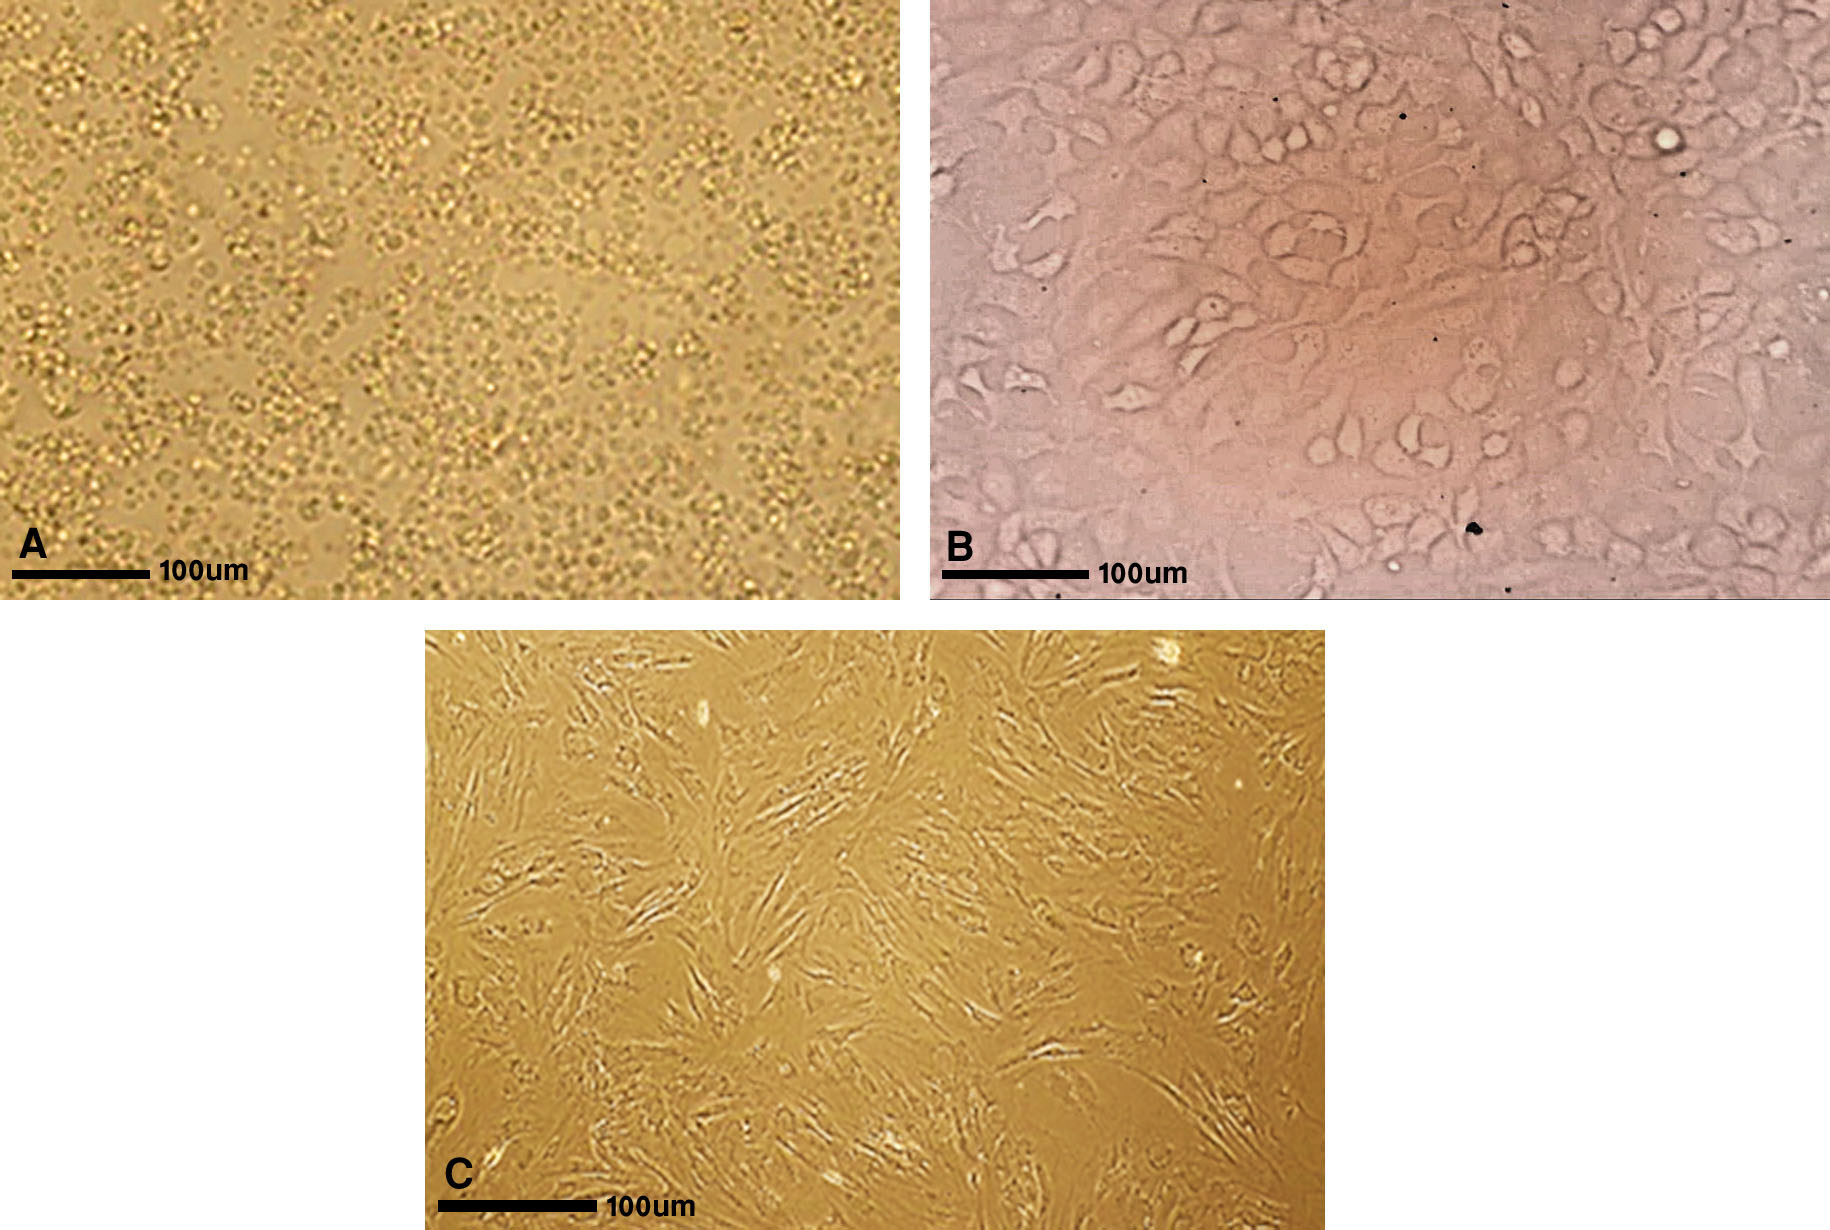
Figure 1. Photomicrograph of cultured liver cells from Acanthupagrus arabicus; A. pre-incubation, B. 9 days after incubation, C. 17 days after incubation.
According to the MMT assay results, the following four concentrations of DEX (3, 3×10, 3×10², and 3×10³ µg/ml) were used to carry out an in vitro cytotoxicity assay using the cytotoxicity endpoint (trypan blue exclusion test). The morphology of liver cells underwent changes after exposure to DEX (Figure 2). Untreated liver cells (control) and those treated with the lower concentration of DEX (3 and 3×10 µg/ml) maintained their epithelioid and polygonal or spindle shape during the experiment. Some cultivated liver cells lost their attachment to the microplate (plucked cells) after 24 h exposure to high doses of DEX (3×10² and 3×10³ µg/ml). Although they appeared dead, they were shown to be alive in the trypan blue exclusion test. Some cells also lost their cellular appendages, becoming rounded, while others became severely swollen (Figure 2).
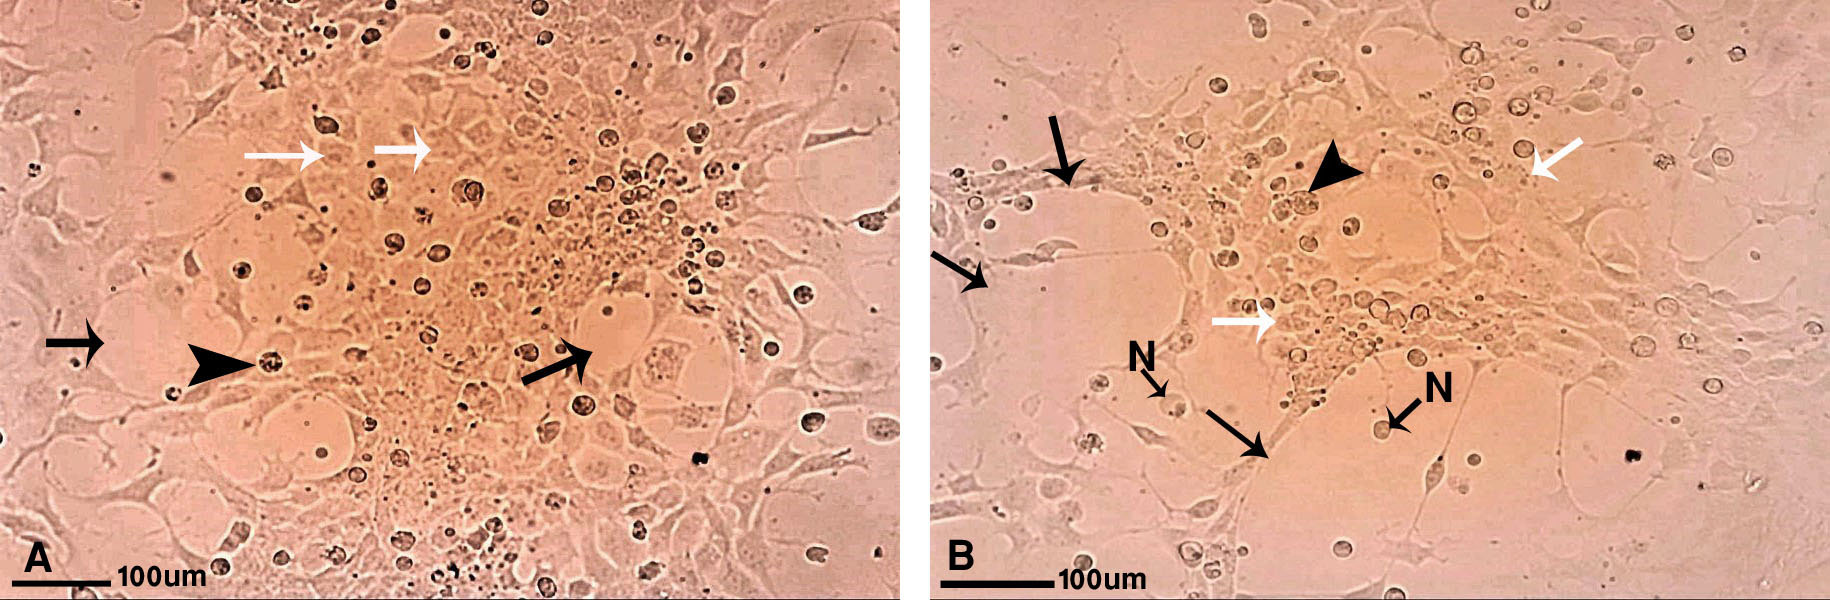
Figure 2. Morphology of cultured liver cells from Acanthopagrus arabicus treated with higher concentrations of DEX (3×10² and 3×10³ µg/ml); Swollen cells (black arrows), round cells (white arrows), plucked cells (black arrowheads); N: nucleus.
Biomarkers
In the present study, various oxidative biomarkers (TBARS, TAC, and GSH) and liver enzymes (ALT, AST, and ALP) were evaluated in the culture media of the control and experimental groups.
Thiobarbituric acid reactive substances (TBARS) assay
As shown in Figure 3A, LPO (as assessed by TBARS concentration) in all DEX-treated cells was not significantly different 12 h after exposure compared to the control group (P>0.05). There was no significant change in the amount of TBARS in the cells treated with the lowest concentration of DEX (3 µg/ml) compared to the control group until the end of the experiment (P>0.05; Figure 3A). The amount of TBARS in cells treated with other concentrations of DEX (3×10, 3×10², and 3×10³ µg/ml) increased in a dose- and time-dependent manner (P<0.05; Figure 3A).
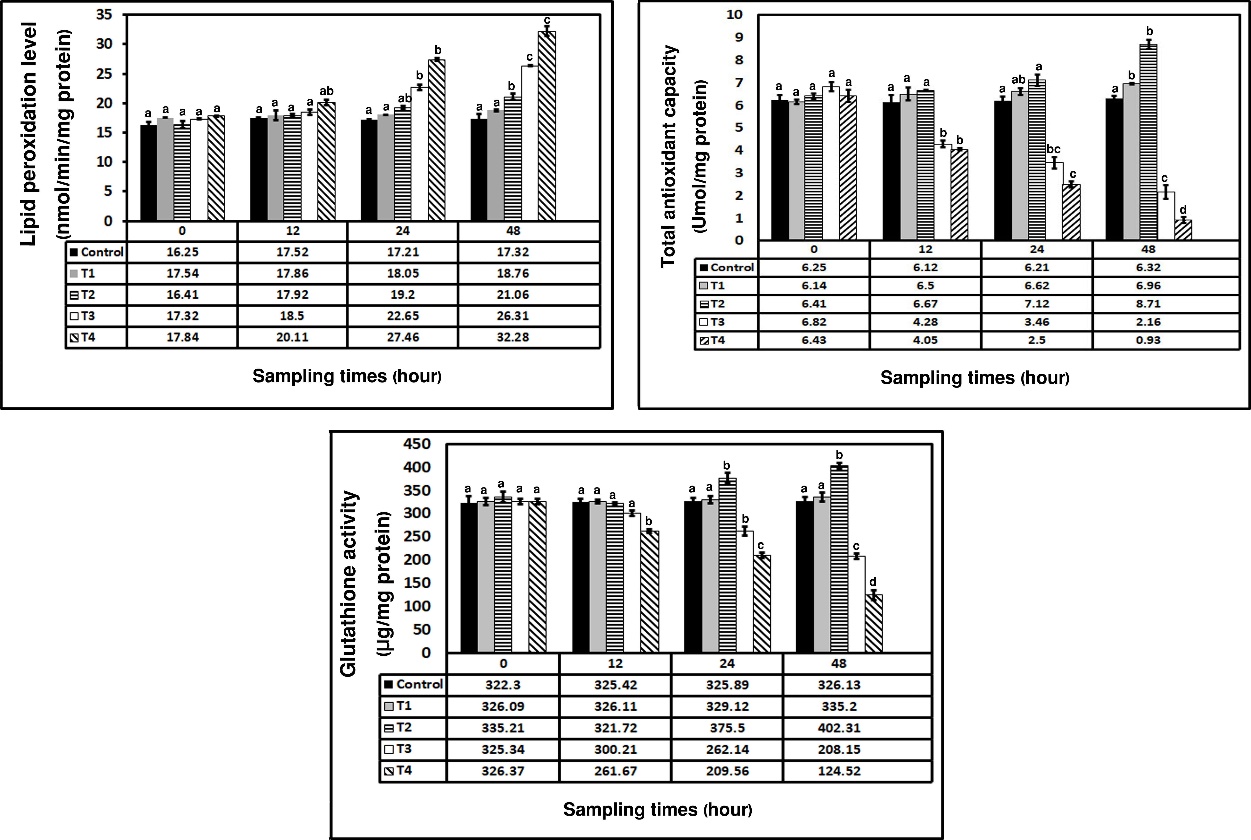
Figure 3. Amount of LPO, TAC, and glutathione activity in cultured liver cells of Acanthupagrus arabicus exposed to different concentrations of DEX during the experiment. Data are shown as mean±SE. Lowercase letters indicate significant differences between different groups (P<0.05). T1: cells treated with 3 μg/ml DEX; T2: cells treated with 3×10 μg/ml DEX; T3: cells treated with 3×10² μg/ml DEX; T4: cells treated with 3×10³ μg/ml DEX.
Total antioxidant capacity (TAC)
According to the results, TAC values in all cells treated with DEX were significantly changed during the experiment in a dose- and time-dependent manner compared to the control group (Figure 3B). According to Figure 3B, there was only a mild increase (22%) in TAC activity in cells that received lower concentrations of DEX (3 and 3×10 µg/ml) after 24 h of the experiment (P>0.05). However, TAV values increased significantly in cells exposed to 3×10 µg/ml of DEX after 48 h of the experiment (P<0.05; Figure 3B). In contrast, higher concentrations of DEX (3×10² and 3×10³ µg/ml) induced a significant decrease in TAC values in treated hepatocytes throughout the experiment (P<0.05; Figure 3B). The lowest amount of TAC was measured in cells treated with 3×10³ µg/ml of DEX after 48 h of exposure (P<0.05; Figure 3B). DEX induced 70% and 84% reductions in TAC values in cells exposed to 3×10² and 3×10³ µg/ml after 48 h, respectively (P<0.05; Figure 3B).
Glutathione (GSH) assay
According to Figure 3C, the lowest DEX concentration (3 µg/ml) did not significantly alter glutathione enzyme activity in treated liver cells compared to the control group (P>0.05). DEX at a concentration of 3×10 µg/ml led to a time-dependent increase in the glutathione activity of liver cells; although this increase was not significant at the beginning of the experiment, the enzyme activity increased by 56% compared to the control group after 48 h of exposure (P<0.05; Figure 3C).
On the contrary, higher concentrations of DEX (3×10² and 3×10³ µg/ml) led to a significant reduction in GSH (P<0.05; Figure 3C). The lowest amount of glutathione activity was measured in liver cells treated with 3×10³ µg/ml DEX after 48 h of exposure (P<0.05; Figure 3C). DEX at concentrations of 3×10² and 3×10³ µg/ml led to a 20 and 30% decrease in GSH in liver cells after 48 h of exposure.
Measurement of ALT, AST, and ALP
According to Figure 4, consumption of different concentrations of DEX altered the AST, ALT, and ALP activities in different ways. The amount of all three enzymes decreased in cells treated with lower concentrations of DEX (3 and 3×10 µg/ml) (Figure 4A, B, C); although the amount of enzymes in cells exposed to 3 µg/ml of DEX was not significantly different from the control group (P>0.05; Figure 4A, B, C).
The AST, ALT, and ALP activity increased dose- and time-dependently in cultivated hepatocytes exposed to 3×10² and 3×10³ µg/ml and reached their peak following 48 h of exposure (P<0.05; Figure 4A, B, C). An approximately 2- to 3-fold increase in the activity of all three enzymes was recorded after 48 h of exposure to 3×10² and 3×10³ µg/ml of DEX (P<0.05; Figure 4A, B, C).
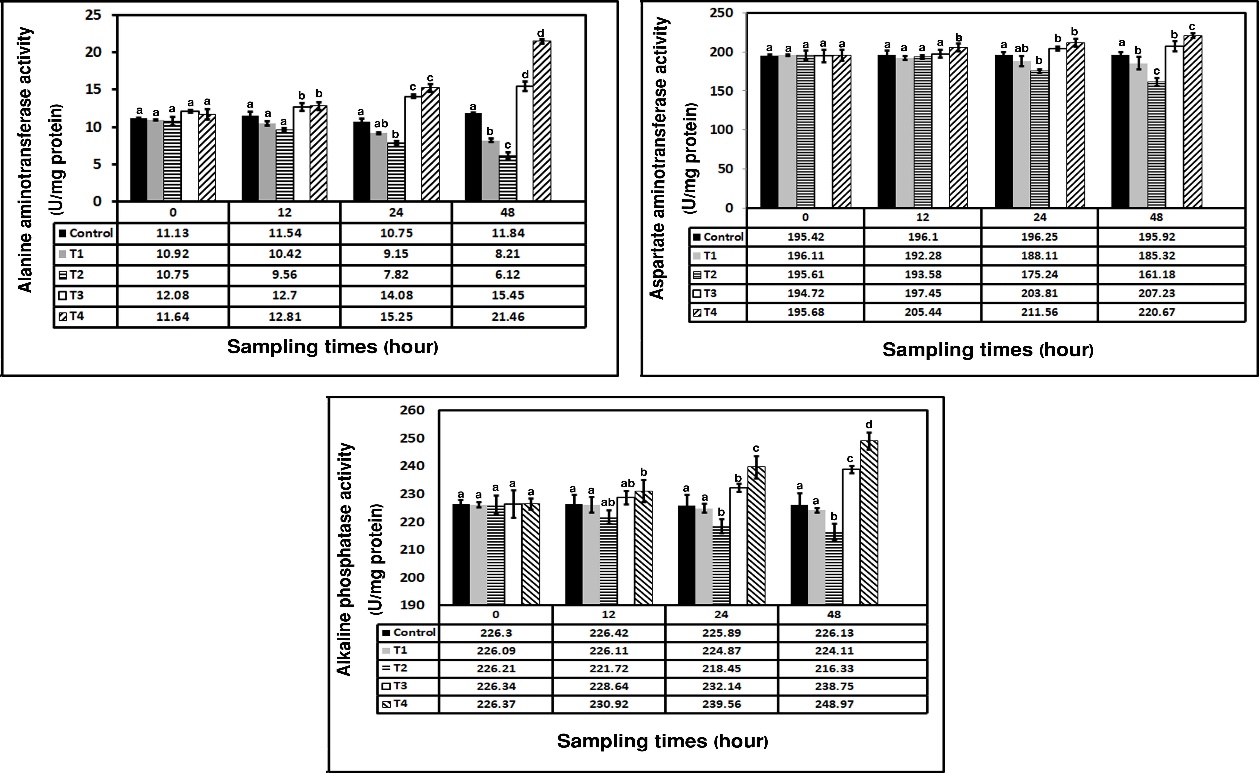
Figure 4. Amount of ALT, AST, and ALP in cultured liver cells of Acanthupagrus arabicus exposed to different concentrations of DEX during the experiment. Data are indicated as mean±SE. Lowercase letters indicate significant differences between different groups (P<0.05). T1: cells treated with 3 μg/ml DEX; T2: cells treated with 3×10 μg/ml DEX; T3: cells treated with 3×10² μg/ml DEX; T4: cells treated with 3×10³ μg/ml DEX.
Discussion
There are limited studies on the effects of synthetic glucocorticoids on aquatic animals. Different fish species have been exposed to various synthetic glucocorticoids, but these studies have mainly focused on the fish's responses to the compounds as stressors rather than as pollutants [20].
Although glucocorticoids are essential for the normal development of different organs, there is consistent evidence that excess exposure to these compounds can have lifelong effects on organisms. Mutsaers and Tofigurehi [21] reported that prenatal exposure of murine neurons to high levels of glucocorticoids caused permanent changes in neuronal cell phenotype and increased their sensitivity to oxidative stress. However, despite glucocorticoids' ability to induce oxidative stress, reports indicate that acute treatment with corticosteroids or chronic exposure to low concentrations of these compounds can suppress inflammatory processes and ROS production [22]. Taghizadieh et al [23]. reported that DEX administration reduces malondialdehyde production after ischemia in lung tissue and maintains cellular levels of antioxidant enzymes.
In the present study, the effect of DEX on cultivated liver cells from A. arabicus was assessed by measuring liver function markers (ALT, AST, and ALP), oxidative stress markers (TBARS and GSH), and antioxidant activity (TAC). The results of the present study showed a significant reduction in TAC and GSH activity, and a significant increase in ALT, AST, ALP, and TBARS in cells treated with the high concentration of DEX.
Some glucocorticoids are generally non-toxic in low or even moderate concentrations [24]. Glucocorticoids prevent the leakage of AST and ALT into the general circulation by maintaining cell membrane integrity [25]. This fact explains the lower concentrations of AST and ALT observed in cells treated with a low concentration of DEX compared to control cells and those treated with a high concentration of DEX. The significant reductions in ALT, AST, and ALP observed in the present study indicate decreased liver cell damage (Jorritsma et al., 2004). Previously, similar results, including decreased liver enzymes and liver damage, in sheep receiving DEX were reported by Yahi et al. (2017). Eken et al. (2006) reported that ALP, AST, and ALT values decreased in rats treated with 0.125 to 0.4 mg/kg DEX. They stated that although DEX, especially at high doses, may cause serious side effects, such as immunosuppression and growth retardation, it is very effective in the management of inflammatory diseases.
In the present study, increased levels of ALT and AST in cells treated with a high concentration of DEX indicate hepatocyte damage. Tovchiga [24] also reported a significant increase in ALT and AST activity in male rats after injection of a high dose of DEX. This result was in agreement with previous findings by Sawy et al. [29] of a significant increase in serum ALT and ALP levels. Considering that high concentrations of DEX disrupt protein metabolism, such changes are possible in the studied enzymes [27]. It has been accepted that glucocorticoids at high doses can intensify gluconeogenesis, and this process is partially supported by the conversion of alanine to pyruvate, leading to an increase in ALT activity [30-31].
Oxidative stress leads to toxicity when the number of free radicals produced exceeds the cell's ability to eliminate them [6]. Measurement of TBARS is one of the most frequently used markers for determining LPO and oxidative damage [32]. Moreover, measuring TAC (including a set of antioxidant enzymes, such as superoxide dismutase, catalase, and glutathione peroxidase, as well as macromolecules, including albumin, ceruloplasmin, and ferritin) provides more reliable biological information compared to measuring its components separately, because it provides the collective effect of all antioxidants in plasma and body fluids [33]. GSH is the main intracellular antioxidant that participates in the elimination of hydrogen peroxide, a toxic byproduct of LPO [34].
Synthetic glucocorticoids have many adverse side effects (including liver dysfunction and organ damage) and limited therapeutic benefits. Liver dysfunction induced by DEX is closely associated with disruption of the mitochondrial respiratory chain, characterized by a significant reduction in complex I activity [35]. This medicine is also considered a major cause of oxidative stress [35]. In the present study, treatment with high concentrations of DEX significantly affected the activity of the oxidative stress markers studied. The TBARS level was significantly higher in cells treated with the high DEX concentration than in control cells. As in the present study, Beytut and Aksakal [36] reported a significant increase in LPO levels in rats receiving a high concentration of prednisolone. Liver LPO is controlled by the balance between available substrates and the levels of initiators and repressors. Increased production of ROS and disruption of the enzymatic and non-enzymatic defense of the liver may cause the activation of lipid peroxides [36]. Therefore, it is conceivable that fish liver cells treated with DEX may tend to produce ROS and lipid peroxides easily. On the other hand, the high levels of free radicals produced by glucocorticoid drugs cause LPO, which in turn alters the fluidity and function of cell membranes [36]. Hegab et al. [37] also reported an imbalance in the redox state, with a significant increase in liver LPO levels and a decrease in antioxidant enzyme levels after the administration of prednisolone in rats (another glucocorticoid). They stated that it could be caused by an increase in ROS due to mitochondrial dysfunction of cytochrome P450 isoforms induced by prednisolone [38].
The TAC and GSH levels were significantly lower in cells treated with the high concentration of DEX than in the control group in this study. In agreement with the present study, Aboelwafa and Yousef [38] reported a significant decrease in serum TAC level and liver GSH level, accompanied by a significant increase in the level of liver TBARS in the male rats treated with hydrocortisone (a glucocorticoid medicine). Lee et al. [39] reported that the hepatic levels of antioxidant enzymes, including GSH-Px, glutathione reductase, SOD, and CAT, decreased in chick embryos after hydrocortisone administration. Moreover, according to reports, corticosterone (a glucocorticoid medicine) suppresses the activity of GSH-Px, SOD, and glutathione-S-transferase (GST) in the liver (Ohtsuka et al., 1998). Similarly, Beytut and Aksakal [36] found a significant decrease in the activities of GSH-Px, SOD, and CAT enzymes, and in the GSH level, in the livers of rats treated with high-dose prednisolone. However, according to these researchers, antioxidant parameters reached control levels within a week.
A decrease in the activity of antioxidant factors following exposure to glucocorticoid medicines is an important sign of disruption of the antioxidant defense system against oxidative damage after these drugs are administered. On the other hand, the improvement of this system in the liver is mainly due to the destruction of lipid peroxides [36].
Conclusions
In conclusion, synthetic glucocorticoids can suppress the antioxidant defense system, as evidenced by the significant increase in lipid peroxides and decrease in antioxidant factors in the liver. On the other hand, according to the results of the present research and some other studies, many studied glucocorticoid medicines, such as DEX, produce toxic effects only in high concentrations, and their low amounts often have no side effects.
Conflict of Interests
The authors report no declarations of interest.
Funding
This research received no specific grant from any funding agency in the public, commercial, or not-for-profit sectors.
Acknowledgement
The authors would like to express their sincere gratitude to all individuals and organizations who contributed to and supported the completion of this study.
Compliance with Ethical Guidelines
The fish were collected with permission obtained from the Iran Fisheries Organization and the Iranian Department of Environment.
Authors' Contributions
Conceptualization: Negin Salamat; Methodology: Ahmad Gabari, Negin Salamat, Asma Mohammadi; the manuscript was written by Negin Salamat. All authors read and approved the final manuscript.
Availability of data and materials
All data generated or analyzed during this study are included.
References
- Adams HR. Veterinary Pharmacology and Therapeutics, 8th ed. Ames Publisher: Iowa State University. 2001;77-81. [LINK]
- Benzie IF, Strain JJ. The ferric reducing ability of plasma (FRAP) as a measure of “antioxidant power”: the FRAP assay. Anal Biochem. 1996;239(1):70-6. [DOI: 10.1006/abio.1996.0292] [PMID: 8660627]
- Beytut E, Aksakal M. Effects of dietary vitamin E and selenium on antioxidative defense mechanisms in the liver of rats treated with high doses of glucocorticoid. Biol Trace Elem Res. 2003;91(3):231-41. [DOI: 10.1385/BTER:91:3:231] [PMID: 12663947.]
- Bjelaković G, Beninati S, Pavlović D, Kocić G, Jevtović T, Kamenov B, et al. 2007. Glucocorticoids and oxidative stress. J Basic Clin Physiol Pharmacol. 2007;18(2):115-27. [DOI: 10.1515/jbcpp.2007.18.2.115] [PMID: 17715567]
- Burkina V, Zlabek V, Zamaratskaia G. Clotrimazole but not dexamethasone is a potent in vitro inhibitor of cytochrome P450 isoforms CYP1A and CYP3A in rainbow trout. Chemosphere. 2013;92(9):1099-104. [DOI: 10.1016/j.chemosphere.2013.01.050] [PMID: 23466084]
- Carvalho IT, Santos L. Antibiotics in the aquatic environments: a review of the European scenario. Environ Int. 2016;94:736-57. [DOI: 10.1016/j.envint.2016.06.025] [PMID: 27425630]
- Chang H, Hu J, Shao B. Occurrence of natural and synthetic glucocorticoids in sewage treatment plants and receiving river waters. Environ Sci Technol. 2007;41(10):3462-8. [DOI: 10.1021/es062746o] [PMID: 17547164]
- Devasagayam TPA, Boloor KK, Ramasarma T. Methods for estimating lipid peroxidation: an analysis of merits and demerits. Ind J Biochem Biophys. 2003;40(5):300-8. [PMID: 22900323]
- Eken H, Ozturk H, Ozturk H, Buyukbayram H. Dose-related effects of dexamethasone on liver damage due to bile duct ligation in rats. World J Gastroenterol. 2006;12(33):5379-83. [DOI: 10.3748/wjg.v12.i33.5379] [PMID: 16981272]
- Gad AS, Khadrawy YA, El-Nekeety AA, Mohamed SR, Hassan NS, Abel-Wahhab MA. Antioxidant activity and hepatoprotective effects of whey protein and spirulina in rats. Nut. 2011;27(5):582-9. [DOI: 10.1016/j.nut.2010.04.002] [PMID: 20708378]
- Galas J, Epler P. Does prolactin affect steroid secretion by isolated rainbow trout ovarian cells? Comp Biochem Physiol. 2002;132(1):287-97. [DOI: 10.1016/s1096-4959(01)00542-5] [PMID: 11997230]
- Guiloski IC, Ribas JL, Pereira LS, Neves AP, de Assis HC. Effects of trophic exposure to dexamethasone and diclofenac in freshwater fish. Ecotoxicol Environ Safe. 2015;114:204-11. [DOI: 10.1016/j.ecoenv.2014.11.020] [PMID: 25645142]
- Hegab II, El-Horany HES, Elbatsh MM, Helal DS. Montelukast abrogates prednisolone-induced hepatic injury in rats: modulation of mitochondrial dysfunction, oxidative/nitrosative stress and apoptosis. J Biochem Mol Toxicol. 2015;114:204-11. [DOI: 10.1016/j.ecoenv.2014.11.020] [PMID: 25645142]
- Herrero P, Borrull F, Marcé RM, Pocurull E. Pressurized liquid extraction and ultra-high performance liquid chromatography-tandem mass spectrometry to determine endogenous and synthetic glucocorticoids in sewage sludge. Talanta. 2013;103:186-93. [DOI: 10.1016/j.talanta.2012.10.030] [PMID: 23200376]
- Holley A.E, Cheeseman KH. Measuring free radical reactions in vivo. Br Med Bull. 1993;49(3):494-505. [DOI: 10.1093/oxfordjournals.bmb.a072626] [PMID: 8221018]
- Jorritsma R, Thanasak J, Houweling M, Noordhuizen JP, Muller KE. Effects of a single dose of dexamethasone-21-isonicotinate on the metabolism of heifers in early lactation. Vet Rec. 2004;155(17):521-3. [DOI: 10.1136/vr.155.17.521] [PMID: 15551926]
- Kemnitzer W, Drewe J, Jiang S, Zhang H, Zhao J, Crogan- Grundy C. Discovery of 4-aryl-4 h-chromenes as a new series of apoptosis inducers using a cell- and caspase- based high- throughput screening assay 3 structure- activity relationships of fused rings at the 7. 8- positions. J Med Chem. 2007;50(12):2858-64. [DOI: 10.1021/jm070216c] [PMID: 17497765]
- Krogdahl A, Mckellep AB, Baeverfjord G. Effects of graded levels of standard soybean meal on intestinal structure, mucosal enzyme activities and pancreatic response in Atlantic salmon (Salmo salar l). Aqua Nut. 2003;9(6):361-71. [LINK]
- Lee JW, Iwatsuru M, Nihigori H. Alteration of activities of hepatic antioxidant defense enzymes in developing chick embryos after glucocorticoid administration—a factor producing some adverse effects. J Pharm Pharmacol. 1998;50(6):655-60. [DOI: 10.1111/j.2042-7158.1998.tb06901.x.] [PMID: 9680077]
- Mikryakov DV, Silkina NI, Mikryakov VR. Effect of dexamethasone phosphate on morphological and functional state of immunocompetent organs of crucian carp Carassius carassius. J Ichthyol. 2004;44(9):788-92. [LINK]
- Mikryakov DV, Mikryakov VR, Silkina NI. Changes in morphophysiological indices of immune-competent organs in common carp (Cyprinus carpio) as influenced by the stress hormone. J Ichthyol. 2007;47(5):401-7. [LINK]
- Mobasher M, Aramesh K, Aldavoud SJ, Ashrafganjooei N, Divsalar K, Phillips CJC, et al. Proposing a national ethical framework for animal research in Iran. Iran J Public Health. 2008;37(1 Supp):39-46. [LINK]
- Momeni HR, Soliemani Mehranjani M, Abnosi MH, Nasimi P. Evaluation of viability in adult mouse spinal cord slices by MTT. Iran J Biol. 2010;267-74. [LINK]
- Musee N, Kebaabetswe LP, Tichapondwa S, Tubatsi G, Mahaye N, Leareng SK, Nomngongo P, et al. Occurrence, fate effects and risks of dexamethasone: ecological implications post-covid-19. Int J Environ Res Public Health. 2021;18(21):11291. [DOI: 10.3390/ijerph182111291] [PMID: 34769808]
- Mutsaers HAM, Tofigurehi R. Dexamethasone Enhances Oxidative Stress-Induced Cell Death in Murine Neural Stem Cells. Neurotox. Res. 2012;22(2):127-37. [DOI: 10.1007/s12640-012-9308-9] [PMID: 22237944.]
- Patchev VK, Hayashi S, Orikasa C, Almeida OFX. Implications of estrogen-dependent brain organization for gender differences in hypothalamo-pituitary-adrenal regulation. FASEB J. 1995;9(5):419-23. [DOI: 10.1096/fasebj.9.5.7896013] [PMID: 7896013]
- Qian K, Zhong S, Xie K, Yu D, Yang R, Gong DW. Hepatic ALT isoenzymes are elevated in gluconeogenic conditions, including diabetes, and are suppressed by insulin at the protein level. Diabetes Metab Res Rev. 2015;31(6):562-71. [DOI: 10.1002/dmrr.2655]
- Rafacho A, Ortsater H, Nadal A, Quesada I. Glucocorticoid treatment and endocrine pancreas function: implications for glucose homeostasis, insulin resistance, and diabetes. J Endocrinol. 2014;223(3):49-62. [DOI: 10.1530/JOE-14-0373] [PMID: 25271217]
- Roy S, Bhattacharya S, Reitman S, Frankel S. A colorimetric method for the determination of oxaloacetic acid glutamic pyruvic transaminase. 2006 (eds) Arsenic-induced histopathology and synthesis of stress proteins in liver and kidney of Channa punctatus. Ecotoxicol Environ Safe. 2006;65(2):218-29. [DOI: 10.1016/j.ecoenv.2005.07.005] [PMID: 16150489]
- Rizzardini M, Lupi M, Bernasconi S, Mangolini A, Cantoni L. Mitochondrial dysfunction and death in motor neurons exposed to the glutathione-depleting agent ethacrynic acid. J Neurol Sci. 2003;207(1-2):51-8. [DOI: 10.1016/s0022-510x(02)00357-x.] [PMID: 12614931]
- Salamat N, Alijani Ardeshir R, Movahedinia A, Rastgar S. Liver histophysiological alterations in pelagic and benthic fish as biomarkers
for marine environmental assessment. Int J Environ Res. 2017;11(3):251-62. [LINK] - Sanchez W, Sremski W, Piccini B, Palluel O, Maillot-Maréchal E, Betoulle S, et al. Adverse effects in wild fish living downstream from pharmaceutical manufacture discharges. Environ Int. 2011;37(8):1342-8. [DOI: 10.1016/j.envint.2011.06.002] [PMID: 21722962]
- Sawy A, ElMaddawy Z, Ashoura N. Role of silymarin in restoring the deleterious effects induced by dexamethasone in male rats. Alex J Vet Sci. 2018;59(2):125-35. [LINK]
- Sedlak J, Lindsay RH. Estimation of total protein-bound and non-protein sulfhydryl groups in tissue by Ellman’s reagent. Anal Biochem. 1968;25(1):192-205. [DOI: 10.1016/0003-2697(68)90092-4] [PMID: 4973948]
- Sies H. Oxidative stress: oxidants and antioxidants. Exp Physiol. 1997;82(2):291-5. [DOI: 10.1113/expphysiol.1997.sp004024] [PMID: 9129943]
- Simons SS Jr. What goes on behind closed doors: physiological versus pharmacological steroid hormone actions. Bioessays. 2008;30(8):744-56. [DOI: 10.1002/bies.20792] [PMID: 18623071]
- Taghizadieh M, Hajipour B, Asl NA, Khodadadi A, Somi MH. Co-administration of melatonin and dexamethasone attenuates lung tissue injury after liver ischemia/reperfusion. Life Sci J. 2013;10:314-20. [LINK]
- Tang V, Young A, Tan H, Beasley C, Wang J. Glucocorticoids increase protein carbonylation and mitochondrial dysfunction. Horm Metab Res. 2013;45(10):709-15. [DOI: 10.1055/s-0033-1345119] [PMID: 23670350]
- Tovchiga OV. Metabolic effects of goutweed (Egopo diumpodagraria l) tincture and metformin in dexamethasone- treated rats. J Med Plants. 2016;2(6):117-26. [LINK]