Mirhoseini S H, Hosseini N, Moradzadeh R, Mehrabian A. Atmospheric Pollutants in an Iranian Industrial Metropolis: Spatiotemporal Analyses Associated with Health Risks and Photochemical Pollutions. IJT 2023; 17 (3) :43-52
URL:
http://ijt.arakmu.ac.ir/article-1-1233-en.html
1- Department of Environmental Health, School of Health, Arak University of Medical Sciences, Arak, Iran
2- Department of Environmental Health Engineering, School of Health, Isfahan University of Medical Sciences, Isfahan, Iran
3- Department of Epidemiology, School of Health, Arak University of Medical Sciences, Arak, Iran. , moradzadehr@yahoo.com
4- Head of the Department of Monitoring and Laboratory Affairs of the General Environment Department of Markazi Province, Arak, Iran
Full-Text [PDF 824 kb]
(740 Downloads)
|
Abstract (HTML) (1964 Views)
Full-Text: (614 Views)
Introduction
Air pollution in large cities, especially in the developing countries, has posed serious environmental challenges. The development of urban communities, the rise in the number of vehicles, energy consumption and industrialization are the among the main causes of rising atmospheric pollution (1). Volatile organic compounds (VOCs) are among the most significant atmospheric pollutants in urban environments. These pollutants, in addition to threatening human health, are the precursors to the formation of secondary organic aerosols and the subsidiary pollutants, including peroxyacetyl nitrate and ozone (2, 3). The urban atmospheric VOCs are emitted from both natural and anthropogenic sources (2, 4, 5). These include vehicles’ exhaust fumes, industrial activities, and compressed natural gas (CNG), emissions, and the use of solvents (6-10). The benzene, toluene, ethylbenzene, and xylene (BTEX) compounds are aromatic elements and have been found as the organic pollutants originated from traffic and industrial activities in urban areas (10). In urban areas, the BTEX compounds encompass over 60% of non-methane VOCs (10, 11). These pollutants are formed by the incomplete combustion of organic materials and are released into the environment through motor vehicle exhaust fumes. The significant adverse effects of these compounds on air quality and human health have identified them as the major atmospheric pollutants by the United States Environmental Protection Agency (U.S. EPA).
Over the past two decades, many studies have focused on the toxicological and health-related effects of BTEX compounds (6, 12-14). The International Agency for Research on Cancer (IARC) has classified benzene as being carcinogenic to humans in group 1 while toluene and xylene were not classified as carcinogenic to humans health among similar materials in group 3 (6, 15). Based on the available evidence, BTEX compounds affect different human organs, such as respiratory tract, liver, kidneys, central nervous and the reproductive systems (12, 16). The increased risk of non-lymphocytic and myeloid leukemia, aplastic anemia, immunological disorders, and myocardial infarction have been associated with exposure to compounds consisting of benzene molecules (17-19). Toluene affects the CNS, and ethylbenzene can lead to eye irritations and brain disorders. Also, xylene can induce inflammatory reactions in the respiratory system and skin. Numerous studies have been conducted globally, evaluating the levels of BTEX elements, and the associated health hazards in the atmosphere of urban areas (2, 4, 20-23). They have pointed out to important factors, such as temporal-spatial variations in the compounds, the ratios of xylene to ethylbenzene (X/E) and toluene to benzene (T/B). The X/E ratio is used for the quantification of the degree of atmospheric photochemical reactivity while T/B ratio is the indicator of emission sources of atmospheric BTEX (6, 24).
Arak is among the large cities in central western Iran. It has the climatic characteristics of the nation’s central plateau, i.e., cold and wet in the winter and hot and dry in the summer. The temperature may rise up to 35°C in the summer and fall below -15°C in the winter. Arak has been identified as one of the largest industrial cities in Iran, and ranked the first for the diversity of its industrial products, while it is the second largest city in terms of the presence of major industries (25). Therefore, people in Arak are exposed to different pollutants both with respect to the quantities and pollutants’ varieties. Despite the fact that many studies have focused on BTEX levels, emission sources, and health hazard assessment in major Iranian cities, there is no well-designed investigation on the levels of atmospheric BTEX compound in Arak to date.
Aim of the Study: In view of the above facts, the present study aimed to investigate the following subjects: 1) determine the atmospheric BTEX levels in Arak and investigate the pattern of temporo-spatial changes for each of the four compounds; 2) evaluate the health risks associated with the BTEX compounds; and 3) assess the ozone formation potential and the sources.
Methods
Geographic Area: Arak, the capital city of Markazi Province, has an area of 107 km2 with a population of approximately 550,000 people in central Iran. The peak temperature may rise up to 35°C in the summer and fall below 15°C in the winter, with the mean annual temperature approaching 14°C. The annual mean rainfall is approximately 350 mm, and the average humidity is around 46%.
Various factors cause Arak to be ranked the eighth most polluted cities in Iran. The major factors include population growth, number of vehicles, rapid industrial growth, and activities of many technological companies in the area (26). Figure 1 illustrates the map, wind speed, and sampling sites in Arak we used for the purpose of the current study. However, due to budgetary constraint, only six sampling sites were considered as the locations to be studied. Specifically, two sampling sites with high-traffic density (A1 and A2), one sampling area with moderate traffic density (A3), two residential areas with low-traffic density (A4 and A5) and one remote area but near the industrial sites were considered (A6).
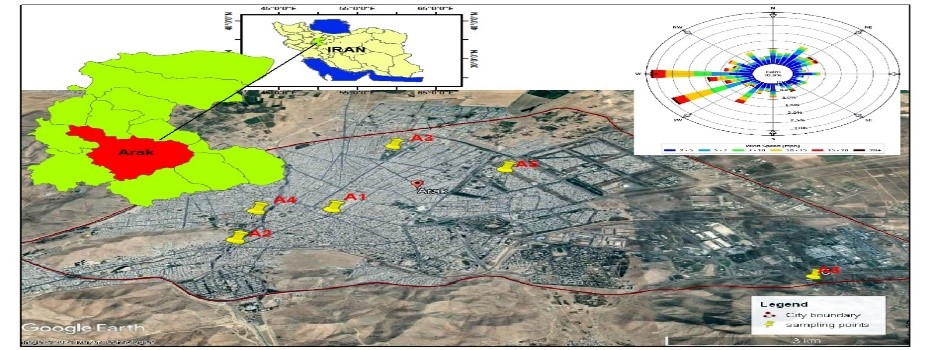
Figure 1. Shows the map of Arak, wind direction and sampling sites.
Sample Collection and Analyses: The BTEX samples were collected from all locations during a one-year period (Dec. 2020 to Dec. 2021) during the four seasons. Sampling was conducted for three days in each season, twice a day, once in the morning (09:00-12:00 h) and once in the afternoon (17:00- 20:00h). A total of 144 samples (24 samples per site) were collected according to the NIOSH-1501 method, using a SKC personal sampling pump operating at a flow rate of 0.2 mL/min for 3hr at 1.5 m at human breathing levels in each location. The atmospheric air traveled through a coconut shell charcoal adsorbent tubes (SKC Inc; 226-01). The glass sample test tubes were 70mm in length and 4mm in diameter. These test tubes were filled with activated carbon at two spots (100mg in front and 50mg back) and were segregated by polyurethane foam at a thickness of 2mm. Sampling was not performed on days with strong rain storm and/or winds. The meteorological data were also obtained from the Department of Meteorology, Markazi Province.
After transferring the samples to the laboratory (under dark and frozen condition), the adsorbent tube content was placed in separate vials, and 1mL of HPLC-grade carbon disulfide (CS2) was added to each vial as an extracting agent. To desorb the BTEX compounds, the vials were stirred on a shaker for 30 minutes as described in a previous article [6]. The extracted samples were evaluated by gas chromatography (GC) (Agilent 7890A, GC/FID), using a HP-5 MS capillary column (30 m, 0.25 mm, 0.25μm film thickness), and flame ionization detector (FID). Duplicate specimens (1μl volume) were injected and the calibration curve was plotted at seven different concentrations (0.1- 10 μgr/mL). The chemicals used to prepare the BTEX standards included extra pure grade for GC obtained from Sigma Aldrich Co. (Darmstadt, Germany). The R2 values for all calibration curves were higher than 0.996. The detection limits for benzene, toluene, ethylbenzene, and xylene were 0.054, 0.065, 0.067, and 0.058μg/m3, respectively.
Sampling Analysis: We calculated the means, standard deviations (SD), medians, the minimal and maximal values for all variables, quantitatively. The data normality was established by one-sample, Kolmogorov-Smirnov method. All variables had non-parametric distribution; thus, Kruskal-Wallis test was used to compare among the BTEX compounds. In addition, Spearman ranking method was employed to determine the correlations among the BTEX compounds. Statistical analyses were performed using SPSS, version 16, with the P-values lower than 0.05 considered as significant.
Spatial Distribution: We used ArcGIS software, version 10.8 to determine the spatial distribution of the atmospheric BTEX compounds. Inverse distance weight (IDW) interpolation technique was used to produce layers for the mean BTEX components and to demonstrate the spread of these contaminants at six sampling sites (6).
Health Risk Assessment: The assessment of health risks is a useful method in environmental studies. The method helps determine the extent of exposure and the risks associated with individual exposure to environmental pollutants. The risk of non-carcinogenic exposure to BTEX mixture, especially due to inhalation of benzene, was evaluated using a method established by the U.S. EPA [5] In this study, we calculated the lifetime cancer risk (LTCR) via the following equation (1): LCRT= CDI × CSF (1)
Where, CDI is the daily intake of pollutants (mg/kg per day) and CSF represents cancer slope factor ([mg/kg]/day)-1. The CSF of benzene was estimated to be 0.029 ([mg/kg]/day). The CDI Value was calculated as: CDI= (Cexp×CF×IR×ED×EF) / (BW×LT) (2)
Where, Cexp is exposed pollutant concentration (μg/m3), CF represents conversion factor (mg/µg), IR indicates inhalation rate (m3/d), ED stands for exposure duration (year), EF is the exposure frequency (d/y), BW is body weight (kg), and LT indicates life expectancy (day). The CF, IR, ED, EF, BW, and LT values were estimated at 0.001, 20 m3/day over 70 years, 350 (d/y), 70 (kg), and 25500 (day) (2, 10, 15, 27), respectively. To calculate the non-carcinogenic risks, the hazard quotients (HQ) were determined, using the following equation (3):
HQ= CDI / RfC (3)
Where, RfC is the non-carcinogenic reference concentration for individual VOCs. The values of RfC for benzene, toluene, ethylbenzene and xylene were 0.03; 5; 1; and 0.1 (mg/m3), respectively. Further, HQ>1 indicates that the potential risk is important, while HQ≤ 1 represents an adequate level since the dose is less than that of RfC (27, 28).
Ozone Formation Potential (OFP): Each of the components in the atmospheric air functions differently toward ozone formation. The OFP was determined according to the VOCs levels and the maximal incremental reactivity (MIR) coefficients (29) was determined based on equation (4): OFP=MIR (g O3/g VOCs) × CBTEX (µgr/m3) (4)
In this study, the updated MIR coefficients were obtained based on the findings of an earlier study (29) conducted in California, USA.
Results
Atmospheric Concentrations of BTEX: In total, 144 samples were obtained to determine the concentration of BTEX compounds in the air. Means and SDs of benzene, toluene, ethylbenzene, xylene, and overall BTEX were 8.39 ± 14.42μg/m3, 15.04 ± 19.95 μg/m3, 4.82 ± 8.04μg/m3, 6.55 ±7.92μg/m3and 34.80 ± 46.99μg/m3, respectively. Similar to the findings in previous studies, the toluene level was the highest compared to other BTEX components (2, 11, 24, 27, 30, 31). The benzene average concentration was consistent with the values obtained for Tabriz (8.17μg/m3) (32) and Ardabil (8.65μg/m3) (33) in Iran, Delhi, India (7.07μg/m3) (2), and Cairo, Egypt (7.8μg/m3) (34). However, lower benzene levels have been reported for urban areas in Orleans, France (24), Yokohama, Japan (35), Rio de Janeiro, Brazil (36) and Arad, Romania (37). Conversely, we found higher concentrations for Yazd (21μg/m3) (11) and Shiraz (>55 μg/m3 in Iran, Kuala Lumpur in Malaysia (4) (58.37μg/m3), and Hanoi in Vietnam (30-123 μg/m3) (38). The difference in the atmospheric BTEX levels in various urban areas may be attributed to the petrol quality, city traffic characteristics, industrial diversity, environmental conditions, and sampling protocols.
Seasonal and Diurnal Variations in Atmospheric BTEX: The seasonal patterns of the atmospheric BTEX are shown in Figure 2. It presents the highest seasonal average concentrations for benzene (16.02±23.54 μg/m3), toluene (26.30±31.82 μg/m3), ethylbenzene (11.24±13.05 μg/m3), xylene (13.43±10.83), and the total BTEX (66.99±72.98 μg/m3) in the summer. As shown in Figure 1, the minimal concentration for benzene (3.95±4.88), toluene (8.09±7.41 μg/m3) and ethylbenzene (1.56±1.49 μg/m3) were observed in the autumn, while xylene was at its lowest level in the spring (2.74±2.16 μg/m3). The total BTEX level was found in the autumn and spring, 16.84±16.13 μg/m3 and 21.85±23.36 μg/m3), respectively. Significant differences were observed among benzene (P = 0.006), toluene (P = 0.008), ethylbenzene (P = 0.001), xylene (P = 0.001) and the total BTEX (P = 0.001) based on the findings for various seasons. Interestingly, our findings are consistent with those reported by the coastal city of Coruña in Spain, and Tehran and Yazd in Iran. In a study conducted in Tabriz, Iran, weather condition and increases in rainfalls during the winter and autumn were identified as the principal causes of the low BTEX levels during those seasons (32). Meanwhile, higher levels of VOCs during the summer may be attributed to the higher emissions via evaporation phenomenon (10). However, previous studies have reported higher BTEX levels during the winter. This is likely due to extreme stability of the atmospheric condition and incomplete distribution of the pollutants in the winter (24, 37).
Comparing the results for morning and evening with respect to BTEX levels suggest that the evening values are higher than that of the morning (Figure 3). The highest and lowest concentrations of BTEX compounds for toluene were in the evening, and for ethylbenzene (4.28 ± 1.72μg/m3) in morning, respectively (Figure 3). However, no significant differences were found for benzene (P = 0.235), toluene (P = 0.195), ethylbenzene (P = 0.268), xylene (P = 0.492) and total BTEX (P = 0.332) between morning and evening hours of sampling. Higher concentrations in the evening may be due to crowded hours of traffic in the city. Further, atmospheric conditions such as, stability, low temperature, night time inversion, and wind speed may play important roles in raising the evening concentrations of BTEX compounds (11).
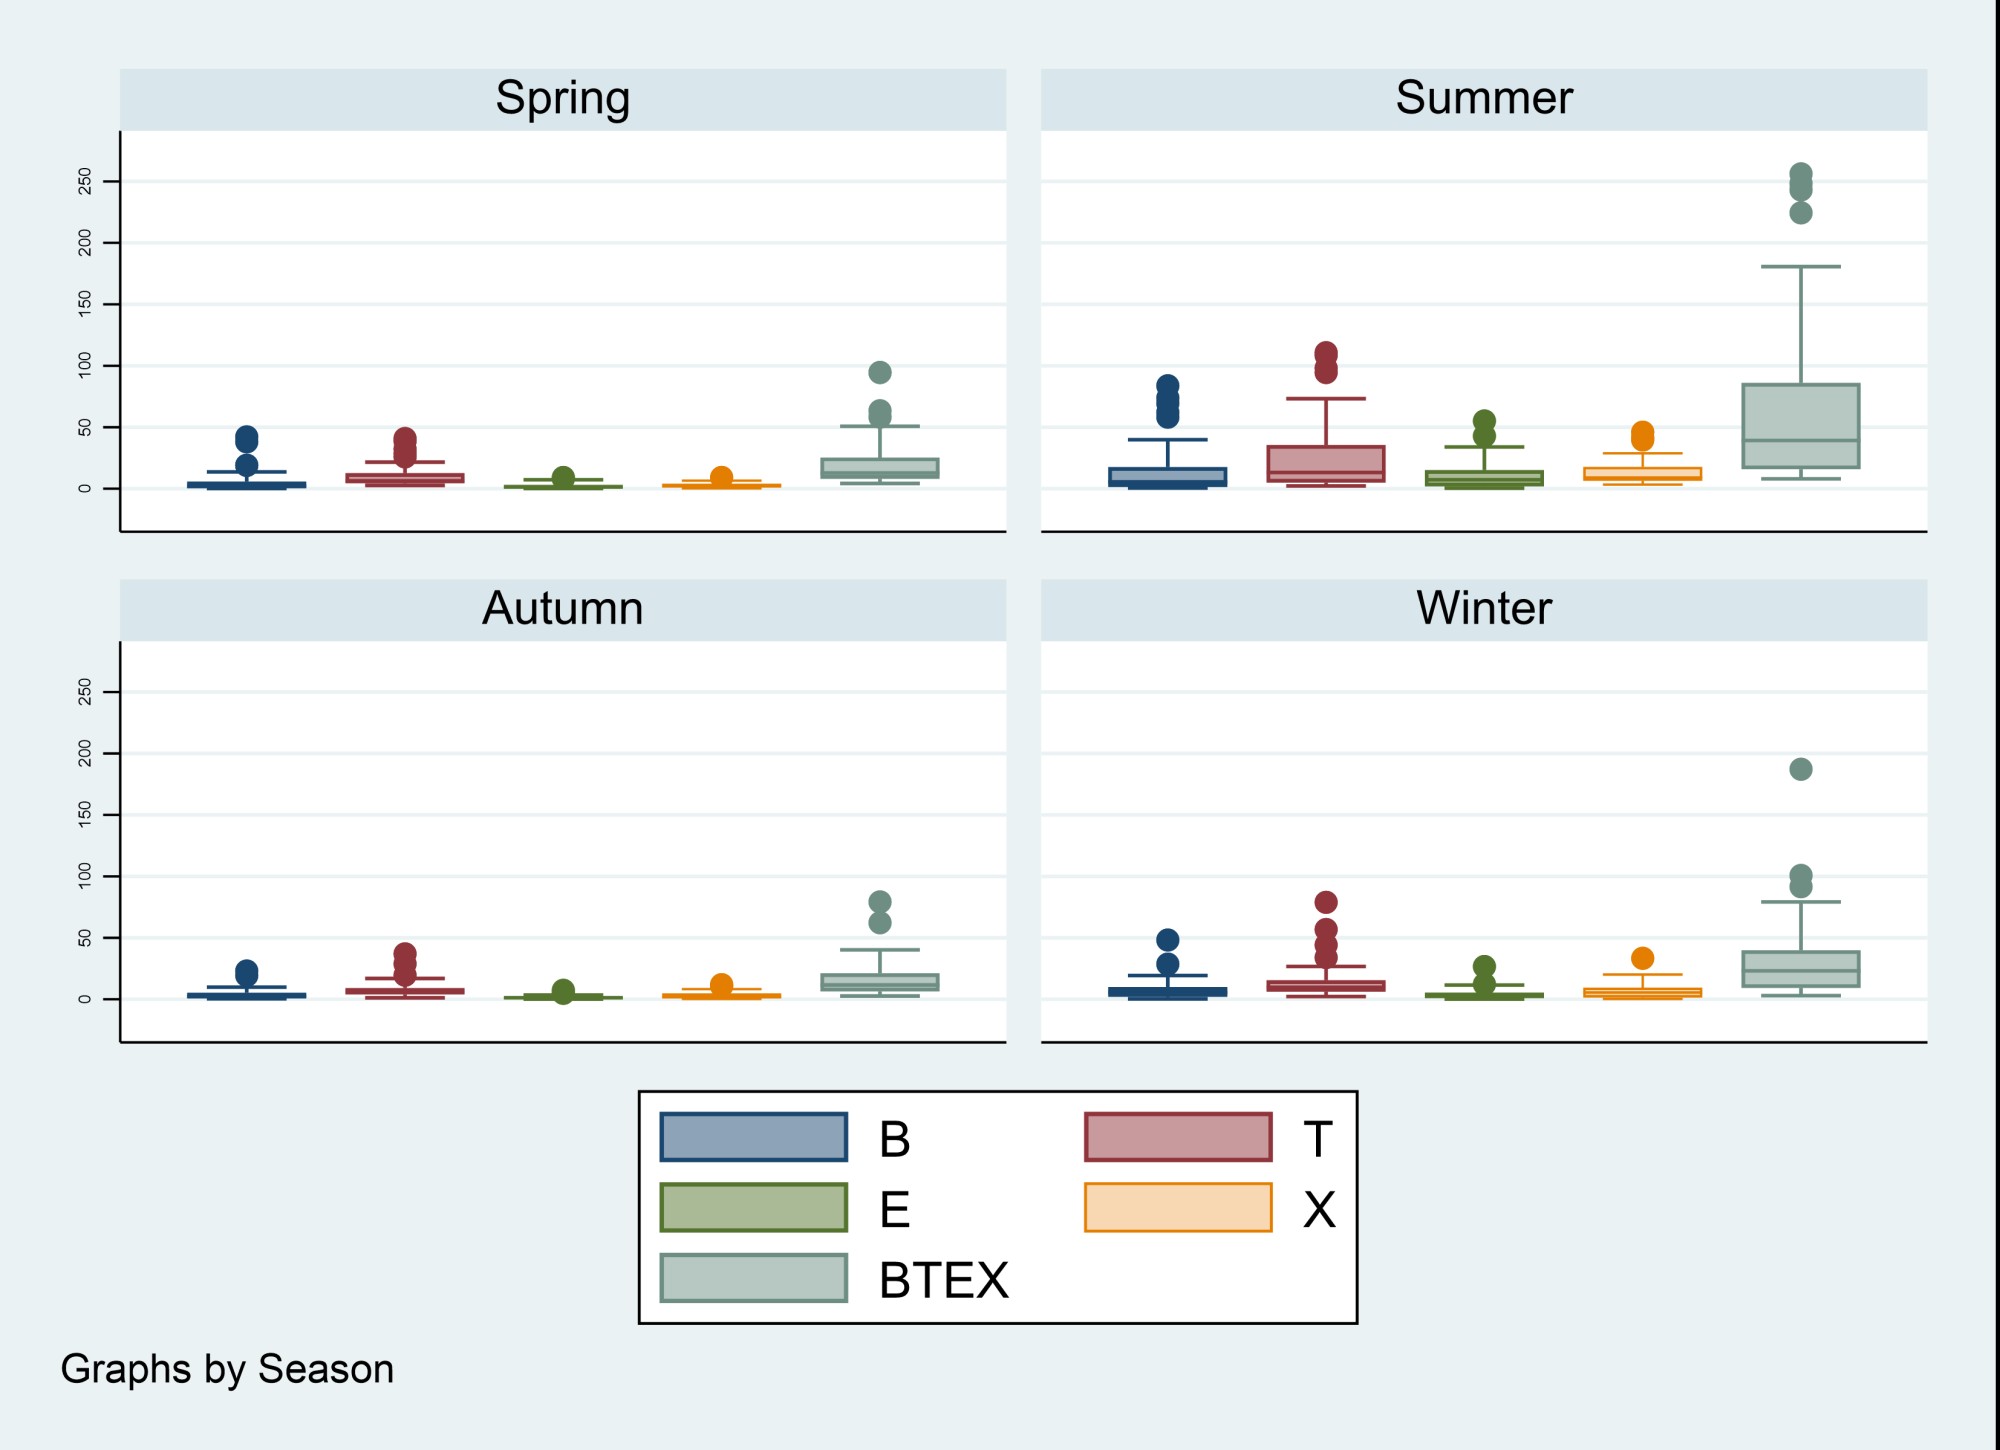
Figure 2. Descriptive statistics of BTEX concentrations by season.

Figure 3. Descriptive statistics of BTEX concentrations by morning or evening times of sampling.
Spatial Analysis: The maximal means for the concentrations of benzene (19.57±20.59μg/m3), toluene (30.36±28.09μg/m3), ethylbenzene (9.59±11.80μg/m3), xylene (10.59±9.32μg/m3), and total BTEX (70.11±66.20μg/m3) were found for high-traffic areas. The minimal means for benzene (1.74±2.22μg/m3), toluene (4.97±3.14μg/m3), ethylbenzene (1.38±1.21μg/m3) and total BTEX (12.06 ± 7.53μg/m3) were observed in locations far from the stations, while the xylene level was also low in low-traffic areas (3.04 ± 3.19μg/m3) (Figure 4).
In Figure 5, spatial variations for total BTEX concentrations during sampling periods were linked to seasons and the sampling hours (mornings or evenings). Based on the map shown in Figure 5, significant spatial changes are observed in different parts of Arak city. The maximal concentration of BTEX was recorded over dense areas with heavy traffic in the city center. Also, considering the heavy wind and its direction (Figure 1), and the presence of Arak petrochemical complex and refinery in the western side, it can be concluded that BTEX compounds travel from west and south toward the city center.
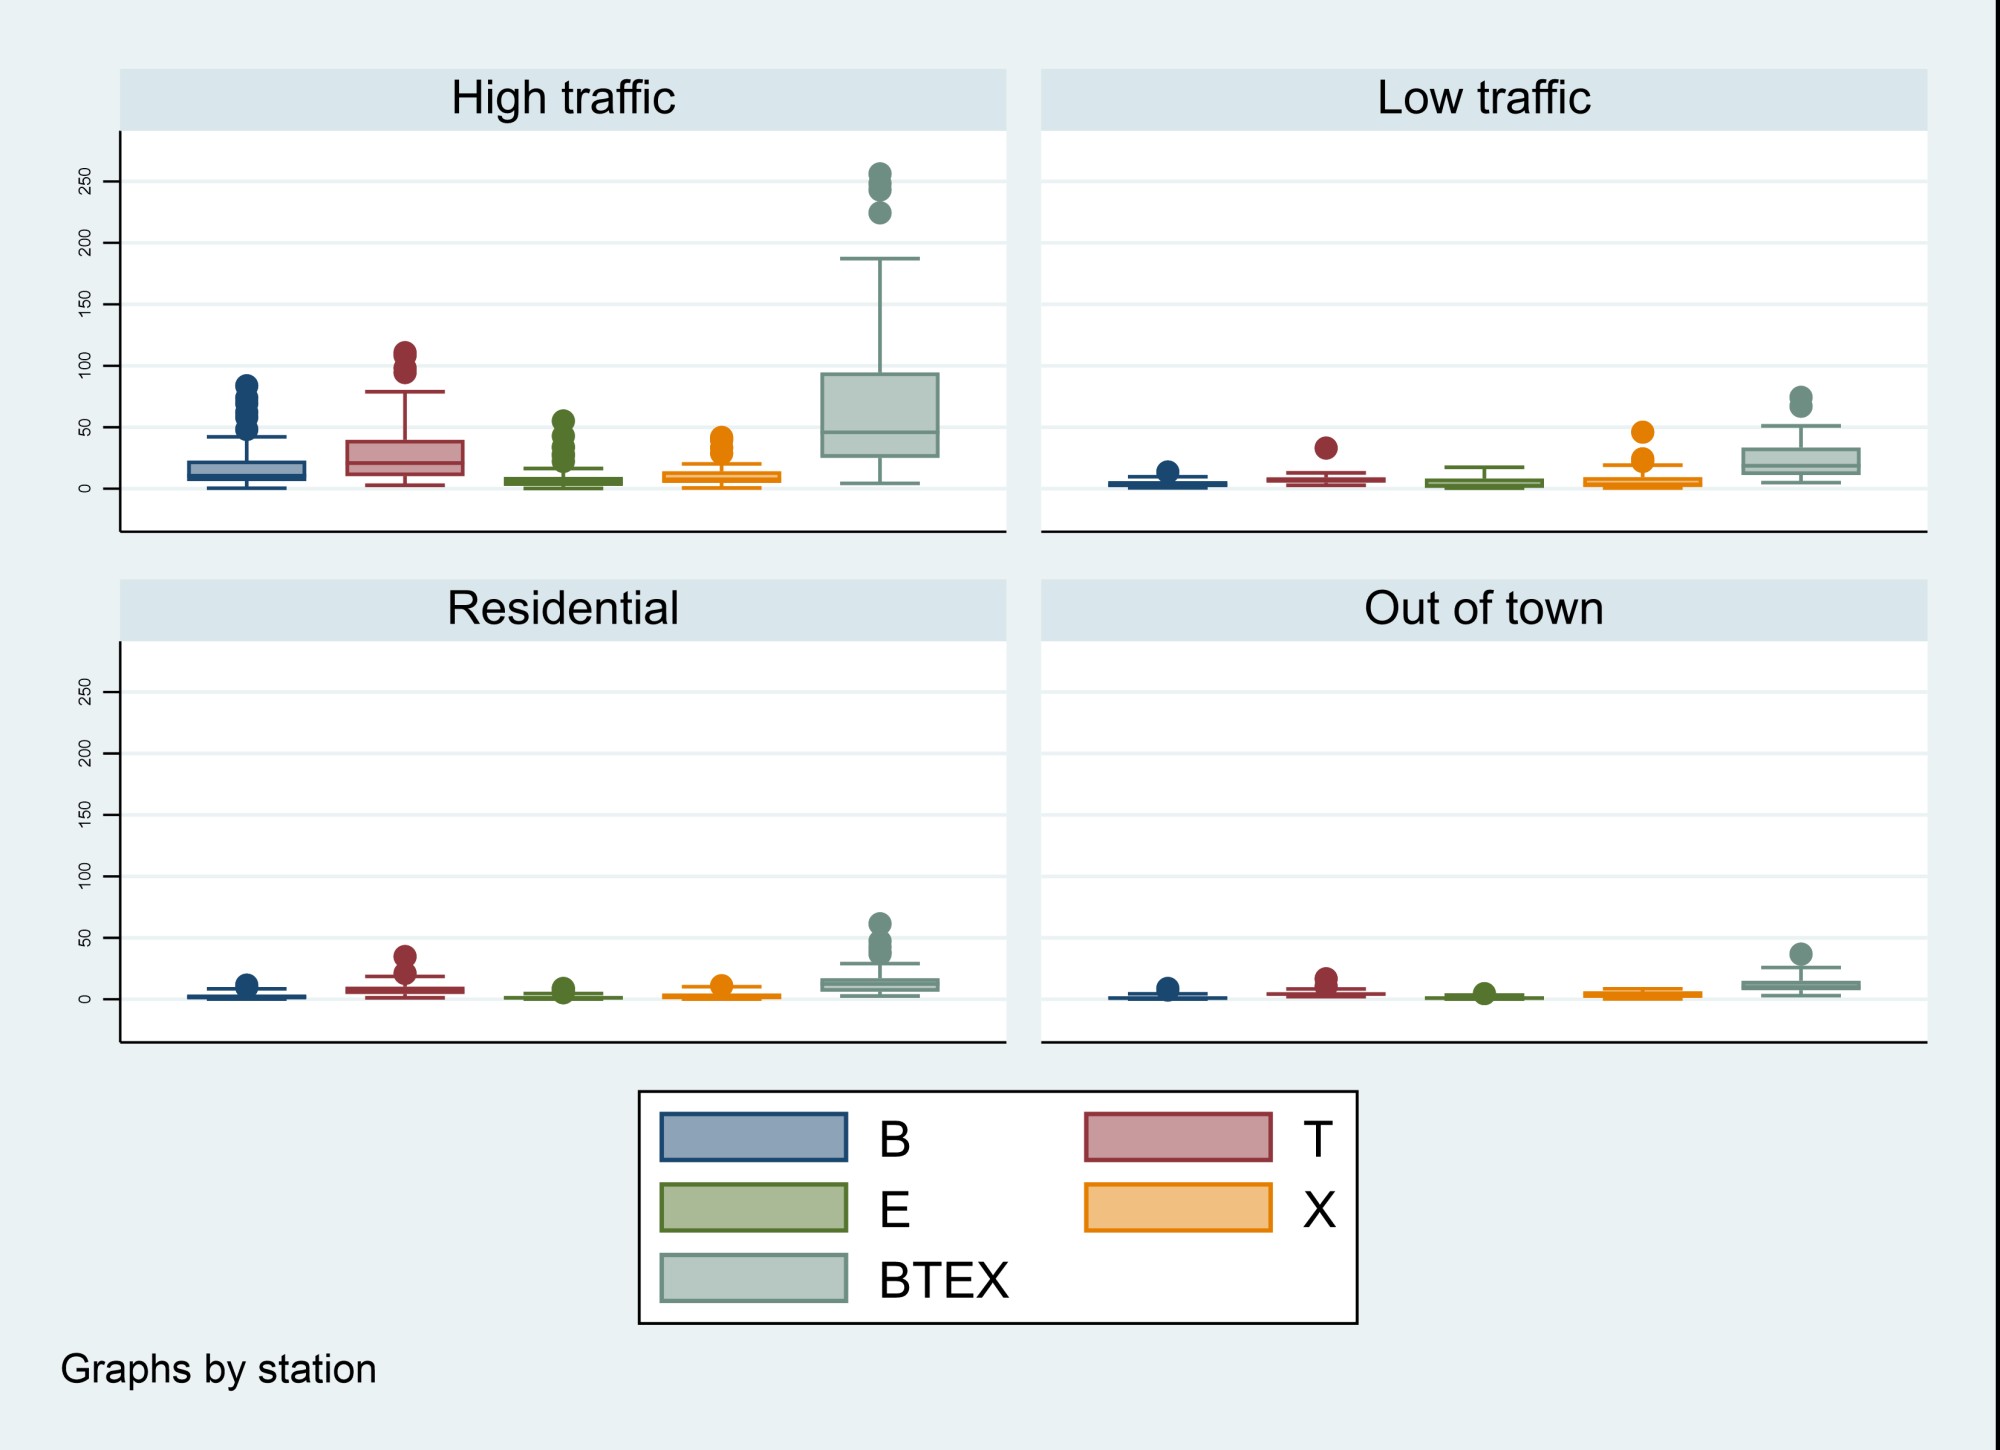
Figure 4. Descriptive statistics of BTEX concentrations by station.

Figure 5. Spatial variation of concentrations of total BTEX during sampling period by season and morning and evening (μg/m3).
Correlation and Ratio of the Atmospheric BTEX Compounds: In previous studies, the interspecies ratios and main components analyses have been used to detect the potential emission sources of the BTEX compounds in the air (2, 27, 32, 39). According to the findings of Spearman's ranking, significant correlations were found among the BTEX compounds in the air. The correlations ranged from 0.65 to 0.93. Please see the detail findings shown in Table 1. Good correlations were found among the BTEX components, indicative of the same source being responsible for the emission of the compounds (27). The significant correlations found among BTEX compounds were obtained in each of warm and cold seasons. The range for correlation coefficients in the warm and cold seasons was 0.47 to 0.91 and 0.85 to 0.95, respectively. The interspecies ratio of BTEX is a valuable indicator for the relative contribution of BTEX sources (11, 39). Table 2 shows the ratios for BTEX compounds, obtained from the concentrations calculated during the sampling time.
The ratio of toluene to benzene was significant for high-traffic areas versus residential and out of town sites (P = 0.001). However, it was insignificant between high versus low-traffic areas. Also, low ratio of T/B in high-traffic areas indicate the contribution of emissions from vehicles in the traffic is important, while higher ratios in other stations indicate a strong link to BTEX levels from stationary sources, such as petrochemical and refinery complexes. Similar results for T/B have been reported by Guanajuato, Mexico (36), Orleans, France (24), Tabriz, Iran (32), and Hanoi, Vietnam (38).
The X/B and X/E ratios are used for the estimation of photochemical reactions and the age of photochemical compounds formed in the atmospheric air. In urban areas, the lower values of these ratios indicate the higher photochemical activities and their greater capacity for ozone formation. In this study, the mean values of X/B and X/E were 2.12 ± 3.75 and 2.35 ± 2.71, respectively, which are consistent with the ratios observed in similar urban areas in Iran (14, 27, 33, 40).
Table 1. Spearman's correlation coefficients between the concentrations of BTEX compounds (All correlations were significant at the 0.001 level).
| Pollutant |
benzene |
toluene |
ethylbenzene |
xylene |
Btex |
| benzene |
- |
0.89 |
0.84 |
0.75 |
0.93 |
| toluene |
|
- |
0.75 |
0.65 |
0.90 |
| ethylbenzene |
|
|
- |
0.85 |
0.92 |
| xylene |
|
|
|
- |
0.88 |
| Btex |
|
|
|
|
- |
Table 2. The Ratio of BTEX compounds during the sampling period in Arak (N = 144).
| Statistics |
B/T |
E/T |
X/T |
X/B |
E/B |
T/B |
X/E |
E/X |
B/E |
B/X |
T/E |
| Mean |
0.43 |
0.33 |
0.65 |
2.12 |
0.98 |
4.33 |
2.35 |
0.71 |
2.00 |
1.32 |
6.54 |
| Median |
0.41 |
0.21 |
0.37 |
0.84 |
0.54 |
2.44 |
1.54 |
0.65 |
1.89 |
1.19 |
4.80 |
| Std. Deviation |
0.25 |
0.41 |
1.05 |
3.75 |
1.40 |
6.33 |
2.71 |
0.49 |
1.21 |
1.16 |
5.99 |
B: benzene, T: toluene, E: ethylbenzene, X: xylene
Table 3. The calculated OFPs (μg O3 m-3) of BTEX at different seasons in Arak.
| Pollutant |
Spring |
Summer |
Autumn |
Winter |
| Benzene |
4.1 |
11.5 |
2.8 |
5.7 |
| Toluene |
44.3 |
105.2 |
32.4 |
58.8 |
| Ethylbenzene |
7.1 |
34.2 |
4.7 |
12.6 |
| Xylene |
21.2 |
103.9 |
25 |
52.7 |
| Total |
76.7 |
254.8 |
64.9 |
129.8 |
Table 4. The mean values of LCR and HR obtained for BTEX in the study area.
| BTEX Compounds |
RFC (µg/m3) |
Mean (min-max) (µg/m3) |
HQ |
LTCR |
| Benzene |
30 |
8.36(0.11-83.7) |
7.6×10⁻² |
6.68×10⁻⁵ |
| Toluene |
5000 |
15.04(1.16-110.7) |
4.6×10⁻⁴ |
- |
| Ethylbenzene |
1000 |
4.8(0.11-55.1) |
2.3×10⁻³ |
- |
| Xylene |
100 |
7.9(0.19-46) |
2.3×10⁻² |
- |
| EPA limit |
|
|
<1 |
<1 ×10⁻⁶ |
RfC: Reference concentration, HQ: hazard quotient; ILTCR: integrated lifetime cancer risk.
Ozone Formation Potentials: The concentrations and reactivity of VOCs species are the key factors to the formation of ozone in the troposphere of urban areas. Maximal incremental reactivity coefficients (MIR) were calculated to assess the role of VOCs involved in ozone formation. The obtained OFPs during different seasons are presented in Table 3. The MIR coefficients for benzene, toluene, ethylbenzene, and xylene were 0.72, 4.0, 3.04, and 7.74 g O3/g VOCs, respectively.
Based on the current study findings, xylene and toluene were the most dominant participants in the formation of ozone among the BTEX species. This finding is consistent with the results reported for Delhi, India (2), Bandar Abbas, Iran (10), and Yokohama, Japan (35). The highest and lowest means for OFP levels were found for the summer (254.8) and autumn (64.9), respectively. Overall, the mean values of OFP during both the summer and winter were greater than the air quality level recommended by WHO for O3 (100 µg/m3) (41) Indeed, both the long- and short-term exposure to high levels of ozone in urban areas is linked to adverse health effects. These are cardiovascular disease, respiratory infections, asthma attacks and inflammatory conditions in the respiratory system (41).
Health Risk Assessment: The health risk evaluation of BTEX compounds in the current study has been undertaken with regard to the model recommended by the U.S. EPA. The model evaluates both the carcinogenic and non-carcinogenic risks of the pollutants toward the human health. The findings of non-carcinogenic risk and average LTCRs of benzene are presented in Table 4. The LTCR limits of benzene recommended by WHO ranges from1×10-6 to 1×10⁻⁵, while the acceptable limit per U.S. EPA is < 10-6. Therefore, the average LCR for benzene (6.68×10⁻⁵) was higher than the proposed limits by both WHO and EPA. Similar LCR results were found for Shiraz, Iran (14), Leon, Guanajuato, Mexico (39), northern India, Yazd, Iran (11), urban area in Malaysia (4) and three locations in China (31). However, the previously reported LCR for Tehran, Iran (3.937×10⁻⁷) in another study (27) was lower than that found in the current study. As presented in Table 4 and based on HQ findings (<1) of present study, the non-carcinogenic health effect of BTEX compounds is much less than that of the carcinogenic ones. The maximal and minimal HQ values belonged to benzene (1×10⁻³–76×10-2) and toluene (6.04×10⁻⁶-4.5×10⁻³), respectively. The calculated HQ is consistent with the reported values for other urban areas in Iran (6, 11, 14, 32, 33).
Conclusions
This study was the first conducted on the evaluation of the emission rate of BTEX compounds and temporal-spatial changes, OFP, and health risk evaluation of the compounds in the industrial city of Arak, Iran. Toluene and benzene were the dominant BTEX species in the atmospheric air of Arak, whereas ethylbenzene and xylene were detected at the lowest concentrations. The diurnal pattern indicated that despite the higher concentrations in the evening than in the morning, there were no significant differences between the mean values of the two sampling times. Significant differences were also found between warm and cold seasons. The lower BTEX levels in the winter and autumn, compared to the warm seasons, may be attributed to increases in the atmospheric precipitations. The spatial distribution analysis showed that the sampling sites with the highest levels were located in the central urban areas with heavy traffic and proximity to the plants, such as Arak Petrochemical and Refinery complex being in the direction of wind currents. The obtained ratio of T/B indicates that the main source of atmospheric BTEX was fuel combustion from vehicles. The T/B ratios in high-traffic urban areas were significantly lower than those in other sampling sites. The mean total OFP levels in various seasons ranged between 76.7 in the spring to 254.8 in the summer. Indeed, the summer and winter values are greater than the air quality guidelines, recommended by WHO (100 μg/m3). The average LTCR of benzene exceeded the thresholds recommended by the WHO (10-5) and the U.S. EPA (10-6). Finally, the acceptable limit of HQ being less than one for all BTEX species indicated minimal risk of non-cancer diseases in the exposed population of Arak, Iran.
Acknowledgements
The authors wish to acknowledge the generous support of the academic staff and management of the Schools of Health at Arak and Isfahan Universities of Medical Sciences, and Department of Environmental Monitoring and Laboratory Affairs of Markazi Province, Arak, Iran.
Compliance with Ethical Guidelines
This work was approved by Arak University of Medical Sciences (Ethics Code: IR.ARAKMU.REC.1399.213). All authors reviewed, understood, and complied with the ethical statements found in the University’s instructions for authors.
Funding
This study was supported solely by the Arak University of Medical Sciences (Grant number: 2829)
Conflict of Interests
The authors declare no relevant financial or non-financial conflict interests with any internal or external entities.
Authors’ Contributions
SHM: Conceptualization, methodology, software choice, data curation, and writing the original draft. RM: Methodology, software choice, data curation, and writing the original draft. NH and AM: Visualization, investigations and software choice.
Data Availability
The datasets generated and/or analyzed during the current study are available from the Corresponding Author upon request.
References
1. Liang L, Wang Z, Li J. The effect of urbanization on environmental pollution in rapidly developing urban agglomerations. Journal of Clean Production. 2019; 237:117649. [doi: 10.1016/j.jclepro.2019.117649]
2. Garg A, Gupta NC. A comprehensive study on spatio-temporal distribution, health risk assessment and ozone formation potential of BTEX emissions in ambient air of Delhi, India. The Science of the total environment. 2019; 659:1090-9. [doi: 10.1016/j.scitotenv.2018.12.426] [pmid: 31096324]
3. Kashyap P, Kumar A, Kumar K. BTEX Concentrations and Associated Health Risks at Urban Vegetative Sites in Delhi, India. Environmental Claims Journal. 2019; 31(4):349-65. [doi: 10.1080/10406026.2019.1640441]
4. Hamid HHA, Latif MT, Nadzir MSM, Uning R, Khan MF, Kannan N. Ambient BTEX levels over urban, suburban and rural areas in Malaysia. Air Quality, Atmosphere and Health. 2019; 12(3):341-51. [doi: 10.1007/s11869-019-00664-1]
5. Mirmohammadi M, Aslemand A. Experimental study of benzene, toluene, ethylbenzene and xylene (BTEX) concentrations in the air pollution of Tehran, Iran. Journal of Research Environmental Health. 2017; 3(2):105-15.
6. Baghani AN, Sorooshian A, Heydari M, Sheikhi R, Golbaz S, Ashournejad Q, et al. A case study of BTEX characteristics and health effects by major point sources of pollution during winter in Iran. Environmental pollution. 2019; 247:607-17. [doi: 10.1016/j.envpol.2019.01.070] [pmid: 30711816]
7. Hajizadeh Y, Mokhtari M, Faraji M, Mohammadi A, Nemati S, Ghanbari R. Trends of BTEX in the central urban area of Iran: A preliminary study of photochemical ozone pollution and health risk assessment. Atmospher Pollution Research. 2018; 9(2):220-9. [doi: 10.1016/j.apr.2017.09.005]
8. Jiang Z, Grosselin B, Daele V, Mellouki A, Mu Y. Seasonal and diurnal variations of BTEX compounds in the semi-urban environment of Orleans, France. The Science of the total environment. 2017; 574:1659-64. [doi: 10.1016/j.scitotenv.2016.08.214] [pmid: 27613674]
9. Carlsen L, Bruggemann R, Kenessov B. Use of partial order in environmental pollution studies demonstrated by urban BTEX air pollution in 20 major cities worldwide. The Science of the total environment. 2018; 610-611:234-43. [doi: 10.1016/j.scitotenv.2017.08.029] [pmid: 28803199]
10. Ghaffari HR, Kamari Z, Hassanvand MS, Fazlzadeh M, Heidari M. Level of air BTEX in urban, rural and industrial regions of Bandar Abbas, Iran; indoor-outdoor relationships and probabilistic health risk assessment. Environmental research. 2021; 200:111745. [doi: 10.1016/j.envres.2021.111745] [pmid: 34303681]
11. Hajizadeh Y, Mokhtari M, Faraji M, Mohammadi A, Nemati S, Ghanbari R. Trends of BTEX in the central urban area of Iran: A preliminary study of photochemical ozone pollution and health risk assessment. Atmospheric Pollut Res. 2018; 9(2):220-9. [doi: 10.1016/j.apr.2017.09.005]
12. Latif MT, Abd Hamid HH, Ahamad F, Khan MF, Mohd Nadzir MS, Othman M, et al. BTEX compositions and its potential health impacts in Malaysia. Chemosphere. 2019; 237:124451. [doi: 10.1016/j.chemosphere.2019.124451] [pmid: 31394440]
13. Hashemi F, Hamidinejad FS, Hoepner L, Rafiee A, Abbasi A, Hoseini M. BTEX exposure of pregnant women and associations with pro-inflammatory cytokines (IL-6 and TNF-α). Air Quality, Atmosphere and Health. 2021; 15(4):1-13. [doi: 10.1007/s11869-021-01122-7]
14. Dehghani M, Fazlzadeh M, Sorooshian A, Tabatabaee HR, Miri M, Baghani AN, et al. Characteristics and health effects of BTEX in a hot spot for urban pollution. Ecotoxicology and environmental safety. 2018; 155:133-43. [doi: 10.1016/j.ecoenv.2018.02.065] [pmid: 29510308]
15. International Agency for Research on Cancer. IARC monographs on the identification of carcinogenic hazards to humans. World Health Organization. Last update 2023. Available from: https://monographs.iarc.who.int/agents-classified-by-the-iarc/.
16. Majumdar D, Mukherjeea AK, Sen S. BTEX in ambient air of a Metropolitan City. Journal of Environmental Protection. 2011; 2(1):11. [doi: 10.4236/jep.2011.21002]
17. Alahabadi A, Fazeli I, Rakhshani MH, Najafi ML, Alidadi H, Miri M. Spatial distribution and health risk of exposure to BTEX in urban area: a comparison study of different land-use types and traffic volumes. Environmental geochemistry and health. 2021; 43(8):2871-85. [doi: 10.1007/s10653-020-00799-6] [pmid: 33411121]
18. Mojarrad H, Fouladi Fard R, Rezaali M, Heidari H, Izanloo H, Mohammadbeigi A. Spatial trends, health risk assessment and ozone formation potential linked to BTEX. Human and Ecological Risk Assessment: An International Journal. 2019:1-22. [doi: 10.1080/10807039.2019.1688640]
19. Amini H, Hosseini V, Schindler C, Hassankhany H, Yunesian M, Henderson SB. Spatiotemporal description of BTEX volatile organic compounds in a Middle Eastern megacity: Tehran study of exposure prediction for environmental health research (Tehran SEPEHR). Environmental pollution. 2017; 226:219-29.
20. Rezaali M, Fouladi-Fard R, Mojarad H, Sorooshian A, Mahdinia M, Mirzaei N. A wavelet-based random forest approach for indoor BTEX spatiotemporal modeling and health risk assessment. Environmental science and pollution research international. 2021; 28(18):22522-35. [doi: 10.1007/s11356-020-12298-3] [pmid: 33420932]
21. Masih A, Lall AS, Taneja A, Singhvi R. Exposure levels and health risk assessment of ambient BTX at urban and rural environments of a terai region of northern India. Environment Pollution. 2018; 242:1678-83.
22. Golkhorshidi F, Sorooshian A, Jafari AJ, Baghani AN, Kermani M, Kalantary RR. On the nature and health impacts of BTEX in a populated middle eastern city: Tehran, Iran. Atmospheric Pollution Research. 2019; 10(3):921-30. [doi: 10.1016/j.apr.2018.12.020]
23. Ercan Ö, Dinçer F, Ceylan Ö. Spatial and seasonal variations of atmospheric BTEX, sulfur dioxide, nitrogen dioxide, and ozone concentrations in Istanbul, and health risk assessment of BTEX. Environment Forensic. 2019; 20(2):149-61. [doi: 10.1080/15275922.2019.1597775]
24. Jiang Z, Grosselin B, Daële V, Mellouki A, Mu Y. Seasonal and Diurnal Variations of Btex Compounds in the Semi-Urban Environment of Orleans, France. Scieince Total Environment. 2017; 574:1659-64.
25. Mostafavi SA, Safikhani H, Salehfard S. Air pollution distribution in Arak city considering the effects of neighboring pollutant industries and urban traffics. International Journal of Energy and Environmental Engineering. 2021; 12(2):307-33. [doi: 10.1007/s40095-020-00379-5]
26. Hosseini HM, Salehi M, Karimi B, Hashiani AA. Association between airborne particles and meteorological parameters in Arak industrial city. Journal of Air Pollution Health. 2021; 6(1):42-53.
27. Miri M, Rostami Aghdam Shendi M, Ghaffari HR, Ebrahimi Aval H, Ahmadi E, Taban E, et al. Investigation of outdoor BTEX: Concentration, variations, sources, spatial distribution, and risk assessment. Chemosphere. 2016; 163:601-9. [doi: 10.1016/j.chemosphere.2016.07.088] [pmid: 27589149]
28. Dehghani M, Mohammadpour A, Abbasi A, Rostami I, Gharehchahi E, Derakhshan Z, et al. Health risks of inhalation exposure to BTEX in a municipal wastewater treatment plant in Middle East city: Shiraz, Iran. Environmental research. 2022; 204(Pt B):112155. [doi: 10.1016/j.envres.2021.112155] [pmid: 34606839]
29. Carter WP. Updated maximum incremental reactivity scale and hydrocarbon bin reactivities for regulatory applications. A California Air Resour Board Contract. California at Riverside, CA.: College of Engineering, Center for Environmental Research and Technology University; 2010.
30. Miller L, Xu X, Grgicak-Mannion A, Brook J, Wheeler A. Multi-season, multi-year concentrations and correlations amongst the BTEX group of VOCs in an urbanized industrial city. Atmospheric Environment. 2012; 61:305-15. [doi: 10.1016/j.atmosenv.2012.07.041]
31. Du Z, Mo J, Zhang Y. Risk assessment of population inhalation exposure to volatile organic compounds and carbonyls in urban China. Environment international. 2014; 73:33-45. [doi: 10.1016/j.envint.2014.06.014] [pmid: 25090575]
32. Tohid L, Sabeti Z, Sarbakhsh P, Benis KZ, Shakerkhatibi M, Rasoulzadeh Y. Spatiotemporal variation, ozone formation potential and health risk assessment of ambient air VOCs in an industrialized city in Iran. Atmospheric Pollution Research. 2019; 10(2):556-63. [doi: 10.1016/j.apr.2018.10.007]
33. Hazrati S, Rostami R, Farjaminezhad M, Fazlzadeh M. Preliminary assessment of BTEX concentrations in indoor air of residential buildings and atmospheric ambient air in Ardabil, Iran. Atmospheric Environment. 2016; 1(132):91-7. [doi: 10.1016/j.atmosenv.2016.02.042]
34. Matysik S, Ramadan AB, Schlink U. Spatial and temporal variation of outdoor and indoor exposure of volatile organic compounds in Greater Cairo. Atmospheric Pollution Research. 2010; 1(2):94-101. [doi: 10.5094/APR.2010.012]
35. Tiwari V, Hanai Y, Masunaga S. Ambient levels of volatile organic compounds in the vicinity of petrochemical industrial area of Yokohama, Japan. Air quality, atmosphere, & health. 2010; 3(2):65-75. [doi: 10.1007/s11869-009-0052-0] [pmid: 20495606]
36. dos Santos Siqueira CY, Lemos MVP, da Cunha Araujo BC, San Gil RA da S, de Aquino Neto FR. Atmospheric distribution of organic compounds from urban areas near Olympic games sites in Rio de Janeiro, Brazil. Microchemestry Journal. 2017; 133:638-44. [doi: 10.1016/j.microc.2017.04.027]
37. Popitanu C, Cioca G, Copolovici L, Iosif D, Munteanu FD, Copolovici D. The Seasonality Impact of the BTEX Pollution on the Atmosphere of Arad City, Romania. International journal of environmental research and public health. 2021; 18(9). [doi: 10.3390/ijerph18094858] [pmid: 34063249]
38. Le Ha VT. Preliminary assessment of BTEX concentrations indoor and outdoor air in residential homes in Hanoi, Vietnam. Vietnam Journal of Science Technology. 2017; 55(4C):78-84. [doi: 10.15625/2525-2518/55/4C/12133]
39. Cerón Bretón JG, Cerón Bretón RM, Martínez Morales S, Kahl JD, Guarnaccia C, Lara Severino R, et al. Health risk assessment of the levels of BTEX in ambient air of one urban site located in Leon, Guanajuato, Mexico during two climatic seasons. Atmosphere. 2020; 11(2):165. [doi: 10.3390/atmos11020165]
40. Tohid L, Sabeti Z, Sarbakhsh P, Benis KZ, Shakerkhatibi M, Rasoulzadeh Y. Spatiotemporal variation, ozone formation potential and health risk assessment of ambient air VOCs in an industrialized city in Iran. Atmospheric Pollut Res. 2019; 10(2):556-63. [doi: 10.1016/j.apr.2018.10.007]
41. World Health Organization. Regional Office for Europe. Air quality guidelines: global update 2005: particulate matter, ozone, nitrogen dioxide and sulfur dioxide. World Health Organization. Regional Office for Europe. 2006.
Type of Study:
Research |
Subject:
General