Enter your email address
Submit


 , Behnoosh Ansari Asl2 , Sonia Asadi3 , Mahdi Abdollahi3 , Rahmatollah Moradzadeh4 , Khazra Alimoradian5 , Nafiseh Khansari *6
The food industry has employed a wide array of coloring agents in its products, with a discernible predominance of synthetic colors attributed to their superior cost-effectiveness and accessibility compared to their natural counterparts [1, 2]. In light of this observation, several nations have sought to regulate the use of coloring agents in food items and have instituted guidelines to mitigate the excessive application of synthetic colors [3, 4].
In accordance with the international standards set forth by various food administration organizations, including the World Health Organization (WHO), Codex Alimentarius, and the Joint FAO/WHO Expert Committee on Food Additives (JECFA), individual countries have formulated their own regulations pertaining to synthetic colorants [3, 5-7]. Consequently, the Iranian National Standards Organization has approved seven synthetic colorants: Quinoline Yellow, Sunset Yellow, Indigotin, Brilliant Blue, Ponceau 4R, Carmoisine, and Allura Red. Nonetheless, this organization has yet to establish specific limits for each colorant concerning various food categories, particularly those predominantly consumed by children [7-12]. The potential health implications for the pediatric population represent a paramount concern that health organizations must address. Children aged 4-7 are particularly inclined to favor visually appealing and soft-textured products. In Iran, there exists no regulatory restriction on the utilization of synthetic colorants in these products, thereby posing a significant risk to children's health and causing serious conditions, such as attention deficit hyperactivity disorder (ADHD) [13]. Various qualitative and quantitative methodologies are implemented for the assessment of colorants in food laboratories, as per the guidelines of Codex and the Official Agricultural Chemists (AOAC) [6, 8, 14-16]. Notably, the high-performance liquid chromatography (HPLC) technique stands out as a practical approach for the determination of food colorants. One of the critical advantages of employing HPLC for the quantitative analysis of colorants is its capacity for simultaneous measurement of multiple colors within a chromatogram, thereby enhancing both efficiency and cost-effectiveness [17-22]. The accumulation of heavy metals through food products in the human body can be deleterious, leading to severe health complications. Therefore, it is imperative to scrutinize the contamination levels of unauthorized artificial colors in food items [23]
Atomic absorption spectroscopy is recognized as the traditional technique for the detection of heavy metals in food samples. On the contrary, the microwave digestion method offers enhanced convenience and accuracy, as it facilitates the thorough digestion of samples under elevated pressure and temperature conditions [23, 24]. In the present study, a novel digestion technique was employed to quantify heavy metals utilizing an atomic absorption spectrometer. Moreover, four widely utilized artificial colorants in jelly powder and soft jelly were simultaneously analyzed using both HPLC and thin-layer chromatography (TLC). In addition, a risk assessment was conducted to evaluate the potential hazards associated with the elevated presence of heavy metals in jelly products targeting the pediatric demographic.
Sample collection
A total of 25 samples were selected from five distinct brands, each representing five different colors: red, blue, green, yellow, and orange, specifically for each category of jelly powder and soft jelly.
Reagents and standards
The calibration standards employed for the determination of concentration were obtained from Sigma Aldrich for both natural and synthetic colorants, while heavy metals standards were sourced from Merck (Germany), with an initial concentration established at 1000 mg/liter. Furthermore, other solvents utilized, including nitric acid, hydrogen peroxide (designated for atomic absorption analysis), methanol, and acetonitrile of HPLC grade, were of laboratory-grade quality.
HPLC-UV analysis
In the sample preparation procedure, the samples were initially subjected to digestion (Sineo MDS 10, China), where 10 grams of each sample were dissolved in a methanol/water mixture at a 1:1 ratio. The resultant mixture was subsequently filtered through a 0.45 µm PVDF filter. The filtered samples underwent analysis via HPLC-UV (ultraviolet detector) using the Platin Blue UPLC system (Knauer, Germany). The mobile phase comprised a buffer acetate at 10 M (pH=7) as elution A and acetonitrile as elution B, combined in a 70:30 ratio, delivered into a C18 column (Nucleodur-100-3 C18, 250 × 2 mm, 3 μm packing, Knauer, Germany) at a flow rate of 0.8 mL/min. An injection volume of 10 μL was utilized, with the column temperature maintained at 30°C. The chromatogram analysis was performed utilizing Clarity Chrome software (Knauer, Germany). The area under the curve of the standard solutions was employed for the comparative analysis of color concentrations within the samples.
Thin-layer chromatography analysis
To conduct a qualitative assessment of the jelly powder and soft jelly, 5-10 grams of each sample were dissolved in a mixture of water and glacial citric acid. Following this, the samples were immersed in a water bath. The chromatography tank was prepared with a composition of 60 ml butanol, 30 ml glacial acetic acid, and 36 ml distilled water, totaling a volume of 100 ml, along with an extraction solution of 2% ammonia in 70% alcohol. The preparation of the chromatography tank was executed at least four hours before chromatography to ensure solvent saturation within the tank. White wool was introduced into the tank and removed after 30 minutes, allowing the solution to dry. The dried solution, which contained artificial colorants, was spotted onto TLC paper and stained, and the types of colors were identified qualitatively.
Atomic absorption
For the measurement of heavy metals, atomic absorption was employed subsequent to microwave digestion conducted under elevated pressure and temperature conditions (Table 1). Graphite furnace atomic absorption spectrometers, specifically the Varian model 800 atomic absorption spectrometer (Varian, Mulgrave, Australia), were utilized for this analysis.
Table 1. Microwave condition and control setup
|
Step (N) |
Temperture (T) / 0C |
Time (t) / min |
Power of single vessel (W) / w |
Power of multi- vessel (W) / w |
|
1 |
130 |
10 |
400 |
1000 |
|
2 |
150 |
5 |
400 |
1000 |
|
3 |
180 |
15 |
400 |
1000 |
Health risk assessment
The mean daily intake of various food groups was considered, and the chronic daily intake (CDI; mg/kg body weight/day) was determined by calculating the average concentration of each food dye or additive along with the amount of food consumed per day. This was calculated using Formula 1:
CDI=∑C×DI/BW
Where C is the concentration of additive content (mg/Kg), DI is the average daily intake (Kg or L/day), and BW is the average body weight set in the study [25].
To assess the overall potential for non-carcinogenic health effects due to synthetic food dyes, the target hazard quotient (THQ) was calculated using Formula 2:
THQ= CDI / RfD
Where CDI is the chronic daily intake of the additive for the average consumer, and reference dose (RfD) is the oral reference dose (mg/Kg/day). A significant risk level is indicated when the THQ value exceeds 1, suggesting a higher likelihood of adverse health effects. The hazard index (HI) for the consumption of synthetic dyes in each food category was calculated as the sum of the THQ values for all food samples:
Total THQ (HI)= ∑THQ [26].
Acceptable daily intake (ADI; mg/kg body weight/day) values were also provided as alternatives to RfD values for the dyes evaluated in this study [9].
Qualitative screening tests
Qualitative screening tests were conducted to determine the presence of artificial or natural colors for each of the five color types. All samples in the jelly powder group, except for one brand (5 samples), contained artificial colors (Table 2). Conversely, in the soft jelly group, three brands (15 samples) used natural colors (Table 2). Samples containing natural colors were excluded from further analysis.
Heavy metal analysis
The heavy metal contents of artificial colors for samples were assessed by atomic absorption. The calibration curve was plotted for copper (Cu), cadmium (Cd), and lead (Pb) (Table 3). By this, the concentration of heavy metals (μg/g) for five different colors (red, blue, green, yellow, and orange) for jelly powder and soft jelly groups was determined. (Table 4). The results demonstrated that Cu is the most and Cd is the least metal observed in all types of colors for both jelly powder and soft jelly groups. Moreover, based on the observed results, the order of the amount of metals found in both groups is as follows:
Pb: Red > Yellow > Orange > Green > Blue.
Cd: Orange > Red > Blue > Green > Yellow.
Cu: Red > Orange > Blue > Green > Yellow.
Therefore, it seems that almost the highest amount of metal was observed in red and orange colors.
Table 2. Qualitative screening tests for jelly powder and soft jelly
|
Sample Groups |
Brands |
Colorant |
Natural color |
Synthetic Color |
||
|
Jelly Powder |
A B C D E |
Red Blue Green Yellow Orange Red Blue Green Yellow Orange Red Blue Green Yellow Orange Red Blue Green Yellow Orange Red Blue Green Yellow Orange |
Positive Positive Positive Positive Positive Negative Negative Negative Negative Negative Negative Negative Negative Negative Negative Negative Negative Negative Negative Negative Negative Negative Negative Negative Negative |
|
Negative Negative Negative Negative Negative Positive Positive Positive Positive Positive Positive Positive Positive Positive Positive Positive Positive Positive Positive Positive Positive Positive Positive Positive Positive |
|
|
Sample Groups |
Brands |
Colorant |
Natural color |
Synthetic Color |
||
|
Soft Jelly |
A B C D E |
Red Blue Green Yellow Orange Red Blue Green Yellow Orange Red Blue Green Yellow Orange Red Blue Green Yellow Orange Red Blue Green Yellow Orange |
Positive Positive Positive Positive Positive Positive Positive Positive Positive Positive Negative Negative Negative Negative Negative Negative Negative Negative Negative Negative Positive Positive Positive Positive Positive |
|
Negative Negative Negative Negative Negative Negative Negative Negative Negative Negative Positive Positive Positive Positive Positive Positive Positive Positive Positive Positive Negative Negative Negative Negative Negative |
|
Table 3. Analytical parameters of calibration curves of the heavy metals (μg/L)
|
Analytical Instrument |
Heavy metals |
Linear range |
Regression equation |
Optical condition |
||
|
Slope |
R2 |
Wavelength |
Slit width |
|||
|
Atomic Absorption |
Pb |
0.0-40.0 |
0.00654 |
0.9990 |
283.3 |
0.5 |
|
Cd |
0.0-.0.8 |
0.11900 |
0.9992 |
228.8 |
0.5 |
|
|
Cu |
0.0-30.0 |
0.01523 |
0.9974 |
324.8 |
0.5 |
|
Table 4. Concentration of heavy metals (μg/g) in different types of jelly powders and soft jelly candies for color types
Jelly powders:
|
Metals |
Pb |
Cd |
Cu |
|||
|
Color Types |
Mean |
Range |
Mean |
Range |
Mean |
Range |
|
Red jelly powder |
1.195 |
0.0815-1.6950 |
0.0059 |
0.0001-0.0012 |
19.0325 |
15.4501-21.0031 |
|
Blue jelly powder |
0.086 |
0.0092-1.0032 |
0.0001 |
0.0042-0.0137 |
17.0001 |
15.3122-20.0123 |
|
Green jelly powder |
0.063 |
0.0024-1.0014 |
0.0005 |
0.0031-0.0011 |
18.0256 |
15.1113-20.6547 |
|
Yellow jelly powder |
0.100 |
0.0081-1.0038 |
N.D |
0.0019-0.0259 |
14.1365 |
14.1654-19.0000 |
|
Orange jelly powder |
0.954 |
0.0243-1.0409 |
0.0029 |
0.0026-0.0415 |
18.8314 |
15.4256-20.0328 |
Soft jelly:
|
Metals |
Pb |
Cd |
Cu |
|||
|
Color Types |
Mean |
Range |
Mean |
Range |
Mean |
Range |
|
Red soft jelly |
1.031 |
0.0645-1.4950 |
0.0046 |
0.0001-0.0012 |
18.9645 |
15.0300-20.1201 |
|
Blue soft jelly |
0.098 |
0.0075-1.0010 |
N.D |
0.0042-0.0137 |
16.2369 |
14.8012-19.0359 |
|
Green soft jelly |
0.079 |
0.0019-1.0003 |
N.D |
0.0031-0.0011 |
17.0003 |
14.5962-20.0178 |
|
Yellow soft jelly |
0.102 |
0.0074-1.0012 |
N.D |
0.0019-0.0259 |
13.0698 |
13.0247-18.0236 |
|
Orange soft jelly |
0.921 |
0.0143-1.0376 |
0.0025 |
0.0026-0.0415 |
18.0364 |
14.9256-20.0059 |
Quantitative detection of synthetic colors
HPLC was used to detect synthetic colors quantitatively. Four synthetic colors (Carmoisine (E122), Brilliant Blue (E133), Quinoline Yellow (E104), and Sunset Yellow (E110)) were detected in red, blue, yellow, and orange, respectively. The green color included both Quinoline yellow and Brilliant blue. The chromatogram for four synthetic colors, retention time, calibration data, and instrumental information of HPLC method are illustrated in Figure 1 (Table 7). It was also observed that the amount of all four types of synthetic colors, E122, E133, E104, and E110 (mg/kg), in group jelly powder is more than soft jelly (Table 5). Moreover, the order of artificial color concentration (mg/kg) in both soft jelly and jelly powder groups is as follows:
Brilliant Blue (blue-E133) > Carmoisine (red-E122) > Quinilone Yellow (yellow-E104) > Sunset Yellow (orange-E110).
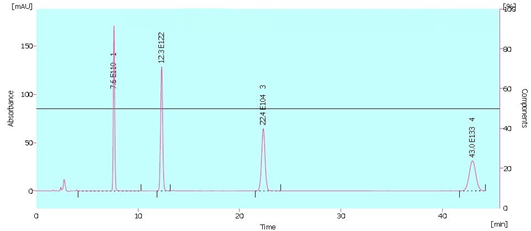
Figure 1. The HPLC chromatogram
Peak and retention time of four color additives
Flow rate 1 ml/min
Peak 1: Sunset yellow, Wavelength (λ)= 506, Retention time (min)= 4.100
Peak 2: Carmoisine, Wavelength (λ)= 526, Retention time (min)= 11.883
Peak 3: Quinilone yellow, Wavelength (λ)= 408, Retention time (min)= 21.567
Peak 4: Brilliant blue, Wavelength (λ)= 610, Retention time (min)= 41.450
Tabel 5. Synthetic color concentration (mg/kg) in soft jelly candies and jelly powders by HPLC method
|
Sample groups |
E110 |
E104 |
E122 |
E133 |
|
Jelly powders |
10 |
11.35 |
13.25 |
15.46 |
|
Soft jelly |
4.6 |
6.71 |
8.97 |
14.52 |
Risk assessment
The risk assessment included various parameters, such as DI, CDI, THQ, HI, RfD, and ADI. The results of the risk assessment are displayed in Table 6.
Table 6. Risk assemssent data information
|
|
|
ADI |
THQ |
CDI |
DI |
RfD |
HI total |
|
Jelly powders |
E104 |
5 |
0.17 |
0.033 |
0.3 |
0.2 |
0.882 |
|
E110 |
4 |
0.58 |
0.15 |
0.3 |
0.26 |
||
|
E122 |
4 |
0.095 |
0.19 |
0.3 |
1.985 |
||
|
E133 |
12.5 |
0.037 |
0.2319 |
0.3 |
6.125 |
||
|
Soft jelly |
E104 |
5 |
0.115 |
0.023 |
0.1 |
0.2 |
5.28 |
|
E110 |
4 |
0.088 |
0.023 |
0.1 |
0.26 |
||
|
E122 |
4 |
5.16 |
0.033 |
0.1 |
0.0065 |
||
|
E133 |
12.5 |
0.11 |
0.72 |
0.1 |
6.125 |
E104: Quinilone yellow; yellow
E110: Sunset yellow; orange
E122: Carmoisine; red
E133: Brilliant blue; blue
ADI: Acceptable Daily Intake (mg/kgbw/day)
THQ: Target Hazard Quotient
CDI: Chronic Daily Intake (mg/kgbw/day)
DI: average daily intake (Kg or L/day)
RfD: Oral reference dose (mg/Kg/day)
HI: Hazard Index
Table 7. Calibration data and instrumental information of the HPLC method
The set-up calibration data:
|
Analyte |
Eqution of calibration Graph |
R2 |
Residuum [mAU.s] |
|
Sunset yellow |
Y=33.45015X+13.8555 |
0.9992376 |
22.7227 |
|
Carmoisine |
Y=36.40637X-15.32372 |
0.9981163 |
35.84102 |
|
Quinilone yellow |
Y=30.99968X+13.16351 |
0.9996874 |
12.72236 |
|
Brilliant blue |
Y=28.38363X+10.09265 |
0.9999596 |
4.84947 |
HPLC Instrumental information:
|
Retention Time (min) |
W05 (min) |
Asymmetry |
Capacity |
Efficeincy [th.pl] |
Eff/l [t.p/m] |
Resolution |
Compound name |
|
7.633 |
0.167 |
1.125 |
0.00 |
11621 |
232419 |
11.164 |
E110 |
|
12.333 |
0.250 |
0.857 |
0.00 |
13483 |
269663 |
13.310 |
E122 |
|
22.350 |
0.383 |
1.000 |
0.00 |
18833 |
376653 |
18.663 |
E104 |
|
42.950 |
0.733 |
1.025 |
0.00 |
19003 |
380070 |
21.768 |
E133 |
Statistical analysis
A correlation analysis was performed using Prism software to investigate the relationship between atomic absorption and HPLC results. Based on the statistical results, no significant relationship was detected between the two methods.
Discussion
The results of this study align with findings from similar research carried out in the European :union: and the United States, where the concentrations of colorants in nutritional products designed for children have raised concerns. The examination of artificial food colorants within jelly powder and soft jelly products has yielded critical insights regarding the exposure levels experienced by consumers, particularly children, who represent the most susceptible demographic due to their reduced body mass and habitual intake of such items. There exists no precise correlation between the concentration of heavy metals in synthetic colorants and the ingestion of such colorants. Given the prevalent application of these colorants in gelatinous products, it is crucial to assess the associated risks of their consumption among pediatric populations [27, 28]. Although the precise quantity of gelatinous product consumption among individuals, particularly children, remains indeterminate, approximations regarding daily intake yield several indicators pertinent to daily risk assessments, as delineated in Table 6. Nonetheless, in light of the substantial amount of production and consumption of gelatinous products within the Iranian market, it appears imperative to reformulate the standards governing the quantity and type of synthetic colorants permitted in these products. Our observations indicated that red and orange colorants exhibit the highest concentrations of heavy metals. Furthermore, it was determined that Carmoisine and Brilliant Blue are the most frequently utilized synthetic colorants. The national standards of Iran impose the most stringent restrictions on Sunset Yellow, as referenced by the Codex, relative to other synthetic colorants [29, 30]. This colorant exhibited the highest concentration of heavy metals in comparison to other colorants (Table 4). Nevertheless, the existing rate of utilization is three times higher than what is allowed in the European :union:. Sunset Yellow is classified as one of seven authorized synthetic colorants in Iran, although it is essential to estimate its daily intake [31].
In this investigation, we identified a significant concentration of Carmoisine and Brilliant Blue within the gelatin powder samples (Table 5). This finding is significant due to the observation that the highest concentration of heavy metals is associated with this particular colorant. Iran's regulatory standards outline and specify only the synthetic food colors that are permitted; nonetheless, they do not impose restrictions on their application in certain colored food products, including those of a gelatinous nature [30, 32]. According to the Iranian National Standard, the synthetic colorants employed in gelatinous products are positioned within the maximum limit range for Sunset Yellow (as per Codex guidelines) [31]. Nevertheless, this concentration is thrice that of the European :union: and is additionally prohibited in gelatin powder [9]. Despite being one of the seven authorized synthetic colorants in Iran, an estimation of its daily intake is requisite. Although Quinoline is not prohibited in numerous countries, including the United States and Europe, it is recognized as another permitted synthetic colorant in Iran [33, 34].
The lowest and highest concentrations of synthetic colorants detected in the gelatinous product samples were Sunset Yellow and Brilliant Blue, respectively (Table 5). Brilliant Blue and Carmoisine colorants were the most prevalent among those observed, while Sunset Yellow and Quinoline Yellow were the least prevalent (Table 5). While the precise daily consumption levels of gelatinous products among children are not ascertained, the elevated consumption rates necessitate a thorough evaluation of the potential risks, particularly in pediatric populations. The daily intake of gelatinous products within the Iranian food industry is considerable [35]. In light of the data presented in Table 6, a re-evaluation of the daily intake standards concerning these products, as well as the types and concentrations of synthetic colorants utilized, is warranted.
The minimal quantities of certain synthetic dyes can lead to accumulation over time, particularly in children, whose developing systems may exhibit heightened sensitivity to chemical exposure. [36]. Synthetic food colorants have been linked to adverse health effects, including behavioral issues in children who frequently consume processed foods. Therefore, while individual dyes may remain within RfD limits, the collective hazard associated with the ingestion of multiple dyes can yield elevated THQ [37]. In our research, this phenomenon was apparent in soft jelly, where the THQ for E122 was as elevated as 5.16, while the RfD for E133 was 6.125, indicating a considerable health risk. Moreover, the HI for jelly products attained a value of 5.28, suggesting that cumulative exposure to various dyes, including E133 and E122, could present long-term health implications (Table 6).
Average local daily intake of Brilliant Blue in jelly products attained a level of 5.55 mg/kgbw/day, which is in proximity to the RfD of 6.125 mg/kgbw/day (Table 6) [38]. This situation raises serious concern over the safety of habitual consumption, particularly among children, who possess a lower body weight and may ingest larger quantities of such products in relation to their body size. Thereafter, due to the correlation between synthetic food dyes and behavioral disturbances in children, such disorders as ADHD can be observed more frequnetly [36]. In the context of Brilliant Blue and Carmoisine, there exists evidence indicating that prolonged exposure, particularly at concentrations near or exceeding the RfD, may present risks associated with neurodevelopmental and allergic responses [39, 40]. Specifically, Carmoisine, with an average local daily intake of 2.22 mg/kgbw/day in jelly powder, surpasses the RfD of 1.985 mg/kgbw/day (Table 6), implying a potential for detrimental effects with consistent consumption [41].
The European Food Safety Authority (EFSA) has established ADI for food colorants, such as Sunset Yellow quantified at 4 mg/kgbw/day (Table 6) [42]. The chronic daily intake (CDI) of Quinoline, derived from the consumption of jelly powder and soft jelly, was quantified at 0.033 and 0.023 mg/kgbw/day, respectively, both values being below the established permissible daily intake or ADI. These findings indicate that the level of Quinoline consumption among the pediatric population in Iran surpasses ADI. Given that this synthetic dye is prohibited in numerous countries, there exists a paucity of information regarding the CDI of this artificial colorant in food products. The CDI for Sunset Yellow in jelly powder and soft jelly was measured at concentrations of 0.15 and 0.023 mg/kgbw/day, respectively. Concurrently, the CDI of Sunset Yellow within the Iranian market exceeded ADI. Furthermore, the CDI values for Carmoisine and Brilliant Blue were also found to surpass the acceptable ADI in the analyzed products, as detailed in Table 6.
The analysis of the gathered data revealed that the THQ values for the four synthetic colors present in jelly product samples exceeded 1. Notably, the highest THQ values for synthetic colorants were identified among the Iranian pediatric demographic concerning jelly powder and soft jelly. Consequently, these products are associated with significant potential health risks for the pediatric population in Iran. Implications for public health outcomes are imperative for enhanced regulation and oversight regarding synthetic colorants utilized in food products intended for children. Specifically, E133 and E122 emerge as the most concerning agents, as their consumption levels in jelly powder products either approach or surpass established safety limits [43]. Policymakers may need to reevaluate the ADI for these colorants.
Nevertheless, owing to regional and cultural variances in dietary practices, as well as the differing methodologies and locations utilized in exposure assessments, drawing comparisons between the dietary habits in this study and those reported in other studies proves to be a challenging endeavor. Furthermore, the elevated hazard indices for soft jelly products, in contrast to jelly powder, underscore the augmented health risks linked to the habitual intake of these items, particularly in instances where multiple colorants are utilized.
The natural pigments, including anthocyanins and carotenoids, may offer safer alternatives for food coloring devoid of the health risks commonly associated with synthetic dyes. This transition to natural colorants has the potential to significantly mitigate health hazards linked to such products as jelly powder and soft jelly, especially for at-risk groups, notably children [44]. Nonetheless, the results indicated that the HI values for all identified colorants exceeded 1. Despite this, the current child population is subjected to substantial potential health risks, underscoring the necessity for heightened scrutiny regarding the consumption of artificial food colors. Therefore, the advocacy for the utilization of natural colorants and the reduction of food products containing synthetic food colorants is strongly recommended.
Conclusions
Although the concentrations of synthetic food colorants in jelly products do not consistently exceed regulatory thresholds, the cumulative exposure to various dyes, particularly among children, constitutes a notable public health issue. The elevated THQ and HI values documented for Brilliant Blue and Carmoisine highlight the necessity for vigilant monitoring and possible reformulation of these products to safeguard consumer health. Future investigations should prioritize examining the long-term consequences of low-dose exposure to synthetic dyes, particularly within pediatric cohorts, and assess the feasibility of natural alternatives to synthetic colorants.
Conflict of Interests
The authors declare no conflicts of interest with any entities.
Funding
This study was funded by the Research Council, Arak University of Medical Sciences (Grant No 3508).
Acknowledgement
This study was funded by the Research Council, Arak University of Medical Sciences (Grant No 3508).
Compliance with Ethical Guidelines
Not applicable.
Authors' Contributions
All authors equally contributed to preparing this article.
1. Reyahi-Khoram M, Setayesh-Shiri F, Cheraghi M. Study of the heavy metals (Cd and Pb) content in the tissues of rainbow trouts from Hamedan coldwater fish farms. Iran J Fish Sci. 2016; 15(2):858–869. [doi:10.22092/ijfs.2018.114577]
2. U.S. Food and Drug Administration. Regulatory Status of Color Additives: FD & C yellow NO. 6. U.S.F.a.D. Administration, Editor. 2022. [Link]
3. Bonan S, Fedrizzi G, Menotta S, Elisabetta C. Simultaneous determination of synthetic dyes in foodstuffs and beverages by high-performance liquid chromatography coupled with diode-array detector. Dye Pigment. 2013; 99(1):36-40. [doi:10.1016/j.dyepig.2013.03.029].
4. Aguilar F, Autrup H, Barlow S, Castle L, Crebelli R, Dekant W, et al. Assessment of the results of the study by McCann et al. (2007) on the effect of some colours and sodium benzoate on children's behaviour - Scientific Opinion of the Panel on Food Additives, Flavourings, Processing Aids and Food Contact Materials (AFC). EFSA J. 2008; 6(3):1–54. [doi:10.2903/j.efsa.2008.660]
5. Dafallah AA, Abdellah AM, Abdel-Rahim EA, Ahmed SH. Physiological effects of some artificial and natural food coloring on young male albino rats. J Food Technol Res. 2015;2(2):21-32. [doi:10.18488/journal.58/2015.2.2/58.2.21.32].
6. Dixit S, Khanna SK, Das M. All India survey for analyses of Colors in sweets and savories: exposure risk in Indian population. J Food Sci. 2013;78(4):642-647. [doi:10.1111/1750-3841.12068] [pmid: 23464814]
7. Farzianpour F, Khaniki GJ, Younesian M, Ghahferkhi BB, Sadeghi M, Hosseini S. Evaluation of food color consumption and determining color type by thin layer chromatography. Am J Appl Sci. 2013;10(2):172–178. [doi:10.3844/ajassp.2013.172.178]
8. Cheibub AMSS, Lyra ESB, Alves BJ, Donagemma RA, Duarte Pereira Netto A. Development and validation of a multipurpose and multicomponent method for the simultaneous determination of six synthetic dyes in different foodstuffs by HPLC-UV-DAD. Food Chem. 2020;323:126811. [doi:10.1016/j.foodchem.2020.126811] [pmid: 32330650]
9. Zahedi M, Shakerian A, Rahimi E, Sharafati Chaleshtori R. Determination of synthetic dyes in various foodsamples of Iran’s market and their risk assessment of daily intake. Egypt J Vet Sci. 2020;51(1):23-33. [doi:10.21608/ejvs.2019.16590.1095]
10. Samadi M, Alimohamadi S, Salari M, Bayat R, Shabanloo A. The survey of types of oral dyes in the pastries of Tuyserkan sity. Pajouhan Sci J. 2018;16(4):14-20. [doi:10.21859/psj.16.4.14]
11. Pehlić E, Nanić H, Jukić H, Aldžić-Baltić A. Determination of heavy metals in hair dyes by the atomic absorption spectrophotometry. Lect Notes Networks Syst. 2019;42:561–567. [doi:10.1007/978-3-319-90893-9_65]
12. Hussein H. Evaluation of the concentration of some heavy metals in hair dyes in Baghdad. Int J Sci Res. 2015; 4(9):687-691. [doi:10.21275/SUB15895]
13. Lehmkuhler AL, Miller MD, Bradman A, Castroina R, Mitchell AE. Certified food dyes in over the counter medicines and supplements marketed for children and pregnant women. Food Chem Toxicol. 2020;143:111499. [doi: 10.1016/j.fct.2020.111499] [pmid: 32599104]
14. Long C, Mai Z, Yang X, Zhu B, Xu X, Huang X, et al. A new liquid–liquid extraction method for determination of 6 azo-dyes in chilli products by high-performance liquid chromatography. Food Chem. 2011;126(3):1324-1329. [doi:10.1016/j.foodchem.2010.11.089]
15. AOAC International. Official methods of analysis: appendix F: Guidelines 2016. Official Analytical Chemists. 1016:1-16. [Link].
16. Boric Acid and Borates in Food Qualitative Test; Manual of Methods of Analysis of Foods Food Additives, M.o.H.a.F. Welfare, Editor. 2016; The Government of India: New Delhi. p: 41. [Link].
17. Poul M, Jarry G, Elhkim MO, Poul JM. Lack of genotoxic effect of food dyes amaranth, sunset yellow and tartrazine and their metabolites in the gut micronucleus assay in mice. Food Chem Toxicol. 2009; 47(2):443-448. [doi:10.1016/j.fct.2008.11.034] [PMID: 19095036]
18. Fuh MR, Chia KJ. Determination of sulphonated azo dyes in food by ion-pair liquid chromatography with photodiode array and electrospray mass spectrometry detection. Talanta. 2002; 56(4):663-671. [doi:10.1016/S0039-9140(01)00625-7] [pmid: 18968541]
19. Gajda-Wyrębek J, Kuźma K, Świtka A, Jarecka J, Beresińska M, Postupolski J. Exposure of Polish children to Southampton food colours. Food Addit Contam Part A Chem Anal Control Expo Risk Assess. 2017; 34(1):1-9. [doi:10.1080/19440049.2016.1254819] [pmid: 27805864]
20. Sun HW, Wang FC, Ai LF. Determination of banned 10 azo-dyes in hot chili products by gel permeation chromatography-liquid chromatography-electrospray ionization-tandem mass spectrometry. J Chromatogr A. 2007;1164(1-2):120-128. [doi: 10.1016/j.chroma.2007.06.075] [pmid: 17692322]
21. Kirschbaum J, Krause C, Brückner H. Liquid chromatographic quantification of synthetic colorants in fish roe and caviar. Eur Food Res Technol. 2006;222(5):572-579. [doi:10.1007/s00217-005-0157-0]
22. Trandafir I, Nour V, Ionică ME. The liquid-chromatographic quantification of some synthetic colorants in soft drinks. Sci Study Res. 2009;10(1):73-82. [Link]
23. Tajik R, Alimoradian A, Jamalian M, Shamsi M, Moradzadeh R, Ansari Asl B, et al. Lead and cadmium contaminations in fruits and vegetables, and arsenic in rice: a cross sectional study on risk assessment in Iran. Iran J Toxicol. 2021;15(2):73-82. [doi:10.32598/ijt.15.2.784.1]
24. Alimoradian A, Tajik R, Jamalian M, Asafari M, Moradzadeh R. Assessment of non-carcinogenic risk of nitrate in agricultural products. Iran J Toxicol. 2021;15(4):257-264. [doi:10.32598/IJT.15.4.784.2].
25. Saleh H N, Panahande M, Yousefi M, Asghari FB, Oliveri Conti G, Talaee E, et al. Carcinogenic and non-carcinogenic risk assessment of heavy metals in groundwater wells in Neyshabur Plain, Iran. Biol Trace Elem Res. 2019;190(1):251-261. [doi: 10.1007/s12011-018-1516-6] [pmid: 30225757]
26. Noori S M A, Zadehdabagh R, Najafi N, Tishezan L, Zerehpoush M, Jazayeri S M H M, et al. Measurement of the toxic trace elements in commercial wheat flours: potential health risk via dietary intake. J Chem Health Risks. 2022;12(4):713-724. [doi: 10.22034/jchr.2021.1935256.1354]
27. Parker GH, Gillie CE, Miller JV, Badger DE, Kreider ML. Human health risk assessment of arsenic, cadmium, lead, and mercury ingestion from baby foods. Toxicol Rep. 2022;9:238-249. [doi:10.1016/j.toxrep.2022.02.001] [pmid: 35198407]
28. Isci G, Orucoglu B, Ekici M. Assessing heavy metal levels in pediatric enteral nutrition formulas available in the Turkish market: Implications for consumer health. Food Chem Toxicol. 2023; 180:114037. [doi:10.1016/j.fct.2023.114037] [pmid: 37714447]
29. Moradi-Khatoonabadi Z, Amirpour M, AkbariAzam M. Synthetic food colours in saffron solutions, saffron rice and saffron chicken from restaurants in Tehran, Iran. Food Addit Contam Part B Surveill. 2015; 8(1):12-17. [doi:10.1080/19393210.2014.945195] [pmid: 25116149]
30. Rezaei M, Safar Abadi F, Sharifi Z, Karimi F, Alimohammadi M, Abadi RAS, et al. Assessment of synthetic dyes in food stuffs produced in confectioneries and restaurants in Arak, Iran. Thrita J Neuron. 2015; 4(1): e22776. [doi:10.5812/thrita.22776].
31. Rovina K, Acung LA, Siddiquee S, Akanda JH, Shaarani SM. Extraction and analytical methods for determination of sunset yellow (E110)—a review. Food Analytical Methods. 2017;10:773-787. [doi: 10.1007/s12161-016-0645-9]
32. Mohammadi H, Vahedi S, Hajimahmoodi M, Nadjarian A, Salsali M, Shokrzadeh M. A survey on the use of synthetic and natural fruit colures in non-certified juice and fruit products in Tehran, Iran. J Mazandaran Univ Med Sci. 2015;24(120):159-172. [Link].
33. Rahnama H, Mazloomi SM, Berizi E, Abbasi A, Gholami Z. Identification of tartrazine adulteration and evaluating exposure to synthetic dyes of sunset yellow and Quinoline yellow through consumption of food products among children. Food Sci Nutr. 2022;10(11):3781-3788. [doi: 10.1002/fsn3.2975] [pmid: 36348810]
34. König J. Food colour additives of synthetic origin. In book: Colour additives for foods and beverages. Elsevier. 2015:35-60. [doi:10.1016/B978-1-78242-011-8.00002-7].
35. Emadzadeh B, Naji-Tabasi S, Bostan A, Ghorani B. An insight into Iranian natural hydrocolloids: Applications and challenges in health-promoting foods. Food Hydrocolloids. 2023;141:108725. [doi:10.1016/j.foodhyd.2023.108725].
36. Kobylewski S, Jacobson MF. Toxicology of food dyes. Int J Occup Environ Health. 2012; 18(3):220-246. [doi:10.1179/1077352512z.00000000034] [pmid: 23026007]
37. Sultana S, Rahman MM, Aovi FI, Jahan FI, Hossain MS, Brishti SA, et al. Food color additives in hazardous consequences of human health: An overview. Curr Top Me Chem. 2023; 23(14):1380-1393. [doi:10.2174/1568026623666230117122433] [pmid: 36650651]
38. Olas B, Białecki J, Urbańska K, Bryś M. The effects of natural and synthetic blue dyes on human health: A review of current knowledge and therapeutic perspectives. Adv Nutr. 2021;12(6):2301-2311. [doi: 10.1093/advances/nmab081] [pmid: 34245145]
39. de Oliveira ZB, Silva da Costa DV, da Silva dos Santos AC, da Silva Júnior AQ, de Lima Silva A, de Santana RCF, et al. Synthetic colors in food: A warning for children’s health. Int J Environ Res Public Health. 2024;21(6):682. [doi: 10.3390/ijerph21060682] [pmid: 38928929]
40. Bakthavachalu BS, Meenakshi Kannan S, Walid Qoronfleh M. Food color and autism: A meta-analysis. In book: Personalized Food Intervention and Therapy for Autism Spectrum Disorder Management. Springer Cham. 2020:481-504. [doi:10.1007/978-3-030-30402-7_15]
41. European Food Safety Authority. Refined exposure assessment for Azorubine/Carmoisine (E 122). EFSA J. 2015;3(3):4072. [doi: 10.2903/j.efsa.2015.4072] [pmid: 40061619]
42. Lehto S, Buchweitz M, Klimm A, Straßburger R, Bechtold C, Ulberth F. Comparison of food colour regulations in the EU and the US: a review of current provisions. Food Addit Contam Part A Chem Anal Control Expo Risk Assess. 2017;34(3):335-355. [doi:10.1080/19440049.2016.1274431] [pmid: 28004607]
43. Potera C. Diet and nutrition: The artificial food dye blues. Environ Health Perspect. 2010;118(10):A428. [doi: 10.1289/ehp.118-a428] [pmid: 20884387]
44. Delgado-Vargas F ,Paredes-López O. Anthocyanins and betalains: Natural colorants for food and nutraceutical uses. 2002:167-219. [doi:10.1201/9781420031713].
| Rights and permissions | |
 |
This work is licensed under a Creative Commons Attribution-NonCommercial 4.0 International License. |