Introduction
Nitrate content in vegetables and edible crops is one of the harmful chemicals for human health [
1]. Nitrate and nitrite are two anions in the nitrogen cycle that are widely distributed in nature. Due to the association of nitrate with methemoglobinemia, a fatal disease, the consumption of foods and beverages with high nitrate contents (0.3% by weight) is harmful to human health, and is linked to certain types of gastrointestinal cancers [
2,
3]. Nitrite may bind food amines to form N-nitrosamine, associated with various types of cancers, including esophageal and stomach neoplasia [
3,
4]. According to studies, all edible vegetables contain nitrates in varying amounts, ranging from 1 to 10,000 mg/kg [
4,
5]. Depending on the type of vegetables, the nitrate contamination varies based on the nitrogen content in the soil, temperature, sunlight, and other factors [
5]. Edible vegetables, such as potatoes, are among the primary sources of dietary nitrate-containing foods and account for 85% of nitrate intake in humans [
4,
6,
7].
Nitrate content is one of the most important factors in determining the quality of vegetables. Nowadays, due to excessive use of nitrogen-containing fertilizers to enhance the vegetations’ growth, many vegetables contribute a high percentage of nitrate to the human diet [
8]. Humans receive the majority of their nitrate by consuming contaminated food products and vegetables. Unfortunately, in many parts of Iran, cucumbers, potatoes, and watermelons have been reported to have high nitrate contents [
9]. Considering that edible vegetables and other kitchen produce absorb and retain large amounts of nitrite and nitrate, the consumption of such products by humans can endanger their health [
9]. Nitrate is a major pollutant that accumulates in food chain mainly due to the use of imbalanced nitrogenous fertilizers in farming industriy.
Nitrate is converted to nitrite in the digestive system of humans and animals, by binding to some amino acids to produce nitrosamine, which is a carcinogenic chemical [
10]. The International Agency for Research on Cancer (IARC) has classified nitrite in foods as a carcinogen of group 2A [
11]. This agency determines the permissible limits of the hazardous substances in agricultural products and the environment [
11]. The Admissible Daily Intake (ADI) of nitrate for humans through food and water consumption is between zero and 3.7 mg/kg of body weight, as set by the World Health Organization and the European :union: Scientific Committee [
12]. Accordingly, a person with an average weight of 70 kg should not consume more than 259 mg nitrate per day.
Fertilizers used in agriculture are the most important causes of nitrate contamination. The presence of nitrate in agricultural materials causes the associated environmental and human health problems [
13]. Due to its adverse effects on human health, much attention has been paid to the accumulation of this chemical compound in edible vegetables and garden produce. Nitrogen is absorbed by plants in two chemical forms: ammonium and nitrate; however, plants prefer adsorbing nitrate compounds [
14]. The nitrate content in plants is influenced by environmental and genetic factors [
15]. Nitrate is non-toxic inherently and is essential in human and animal diets. However, its metabolites and biproducts, such as nitrite, nitric oxide, and nitrous compounds, can have harmful effects on human health [
16]. Due to the contamination of soil and agricultural products with nitrous compounds, the contents of nitrate and nitrite in vegetables have become one of the public health concerns in recent years. The objective of this study was to assess the nitrate contents in popular agricultural products, both at the supplier level and in general consumption by people.
Materials and Methods
Sampling: To collect the information on nitrate contents in 18 agricultural products, we contacted the main greengrocers in Arak, and completed a detailed form based on the available documents. The products were leafy fruits and vegetables, tuber, kitchen produce, grains and cereals. These included leafy vegetables, lettuce, spinach, cabbage, potatoes, carrots, onions, sugar beets, beetroots, eggplants, watermelons, melons, tomatoes, edible mushrooms, pinto beans, soy protein, wheat and rice were sampled each month if available. The sample size was determined based on the cargo bills, and the suppliers information in the summer and winter of 2019. The sampling occurred at least 9 times per season, collecting about 1-3 kilog of each product, containing at least 10 pieces of each product per kilogram [
17]. The samples were transferred to Marjaan Khatam Laboratory in Tehran on a monthly basis, and stored in a cold room at optimal conditions, with each group bearing its identification tag and number.
Sample preparation & laboratory Methods: The determination of the nitrate levels were carried out according to established standards, using a uv/vis spectrophotometer (Shimatdzu; Japan). Initially, the edible parts of the produce were separated and washed with regular and then deionized water to prepare the study samples. The samples were dried, crushed, and homogenized, and a 100g of each sample was collected and placed in an incubator at 80°C, with the drying time dependant on the desired texture of the sample. For example, thin vegetables (lettuce, celery, cabbage, and radish leaves) needed 12 hours, while vegetables with thick and fleshy texture (potatoes, tomatoes, and radish tubers) took 24 hours to dry completely. In the case of watermelons and cantaloups, their extracts were prepared, using a grinder and then measured. Ten grams of these produce, such as cantaloupe, was added to 25 mL 2% acetic acid, shaken for 30 minutes on a rotary shaker then centrifuged for three minutes at 5000 rpm, filtered through Wattman’s paper, and read at 400 nm on a uv/vis spectrophotometer. The experiments followed the instructions provided by the Institute of Standards and Industrial Research of Iran (document No. 4106) [
12].
Statistical analysis: Due to the abnormal distribution of nitrate in the samples, nonparametric statistical tests were used for the analyses. For each product, the nitrate content was checked and compared for winter versus summer, using the Mann-Whitney test. For comparison among the samples, we used Kruskal-Wallis test. To analyze the data, we grouped them by the product’s region and the type. The farming regions were divided into five central areas (Alborz, Dezful, Isfahan, Hamedan, Markazi, Qazvin), West (Khorramabad, Ahvaz), East (Bojnourd, Mashhad), North (Mazandaran), and South (Bandar Abbas, Shiraz, Chabahar). The crops were categorized into leafy (lettuce, vegetables, spinach & cabbage), kitchen produce (watermelon, melon, tomato, eggplant & edible mushroom), grains (beans, soy beans, rice & wheat), tuber vegetables (onions, potatoes, carrots, sugar beets & root beets).
Risk assessment: To assess the humn health risk of non-cancerous diseases, we used the formula provided by the U.S. Environmental Protection Agency (USEPA)[
17-
19]. First, we calculated the number of contaminants absorbed in the products per kilogram of body weight per day, using the following Equations:
EDI=(CF×IR×EF×ED)/(BW×AT)
EDI=Daily absorption of pollutant
CF=Concentration of contaminants in food
IR=Daily consumption
FI=amount of pollutants absorbed by the body through food
This coefficient varied between 0.25 and 0.4 [
17].
EF=the frequency of consumption per year
ED=the number of years used this food
In this study was 33.2.
BW=Body weight
In this study was considered 55.9 kg for adults and 15 kg for children [
20].
AT=Multiply the ED by the number of days per year
THQ=EDI/RFDi
Was used to determine the risk of non-cancerous diseases [
17].
RFD=maximum tolerance
The following Equation was also used to assess the extent of exposure [
21]:
Exposure assessment=Concentration of the hazard (ng/g)×Food consumption (g/day/w)
Results
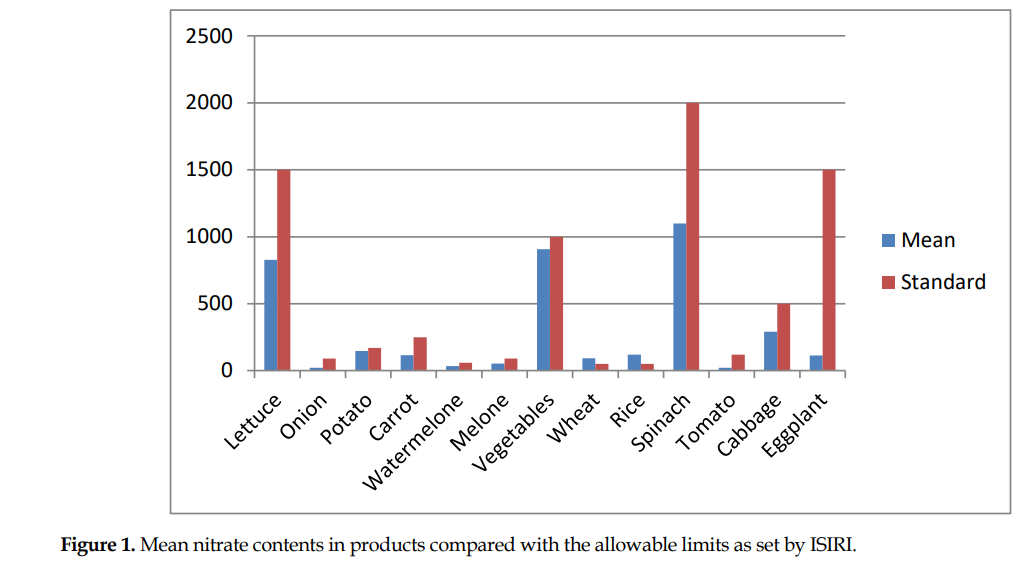
Due to the normal distribution of the data derived from Kolmogorov-Smirnov test, we used nonparametric tests for the statistical analyses. The average amount of nitrate measured in the products was 165±27.88 ppm. The means for nitrate contents in the products and their permissible limits, based on the national standard, are shown in
Figure 1.
The results of nitrate contents in leafy, tuber, root, and kitchen produce samples for both summer and winter are shown in
Table 1.

As evident by this table, the highest contamination of nitrate was related to leafy vegetables, followed by the grains and cereal samples. Geographically, the highest nitrate content was from the northern regions and the lowest found in the western areas of Iran. Also, the nitrate contents of the crops were lower for the warm season than that of the cold season.
Assessment of exposure and undesirable effects: Based on the results of the exposure assessment, the high consumptions were for tuber vegetables (19500), lettuce (18000), tomato (13080) (g/day/w), and the low consumptions belonged to mushrooms (42), legumes (1900), onion (3510) (g/day/w) and the average consumption is 1910.3 (g/day/w).
Pathogenic rates: The potential pathogenic risks of the products are presented in
Table 2.

According to the formula for Target Hazard Quotient (THQ), most of the products carried their risk of pathogenicity. Also, the nitrate aggregation was higher than the permissible limits in such products as leafy vegetables, rice, wheat, and potatoes. However, due to the cumulative effects of nitrate over time and consumption of other foods, such as ready-made meat products [
22] and drinking water [
23], there is also a risk of non-cancerous pathogenicity for other products, such as melon, carrot and eggplant.
Discussion
In this study, nitrate exposure was assessed for food safety, based on the average and highest concentrations of the contaminant in different regions. The results showed that the mean exposure rate in the northern areas was the highest (106.78), with the western regions having the lowest rate (40) of nitrate contamination (P=0.05). This suggests that the soil type, fertilization practices, rainfall and irrigation, cultivation frequency and type, differences in geographic locations, absorption rate, and using chemical fertilizers influence the nitrate accumulation in the vegetables. According to other reports, nitrate from fertilizers quickly penetrates into light and permeable soils. This reduces the nitrate contents in plants. Howerver in heavy and less permeable soils, nitrate remains in the plant roots, and the content in them rises. For this reason, in farms with light soils, less fertilizer remains available and accumulate in crops [
24,
25]. The most contaminated samples with nitrate were leafy products (129.74 ppm) with the least contaminated ones (47.95 ppm) being the tuber vegetables. This suggests that nitrite and nitrate contents vary with the type of vegetables and products. The important factors include genetic structure, being tuber or leafy, root structure, water absorption rate, and acidity or alkalinity of the product [
9].
The other studies have reported that the amount of nitrate in vegetables varies from country to country and in different regions of the same city or country [
26-
28]. Hasani Moghadam et al. [
8] have reported that nitrate levels are higher in tuber parts than that in the plant leaves. Their finding is inconsistent with our results. While Shahbaz-zadegan [
29] and Pourmoghimi [
30] reported that the order of nitrate contents was highest in leafy vegetables followed by roots and tubers, and the lowest in vegetables. Further, the highest nitrate contamination was observed in the spring, which is inconsistent with those reported earlier by Alemzadeh [
31] and Doomari [
25], who reported higher nitrate accumulation in plants in the winter. However, many studies elsewhere in the world have reported that temperature negatively affects the plant growth and influences the nitrate content [
24,
32-
34]. Colla et al. have suggested that crops produced in the late spring contained more nitrate than those in the winter [
24].
Exposure to diets contaminated with nitrate and nitrite results in the formation of nitrosoamines, thus becoming a significant public health issue. This is likely to lead to acute and chronic conditions, such as methemoglobinemia, thyroid disorders and some forms of cancer [
26]. Previous studies have shown that nitrate can impair iodine absorption by the thyroid gland, leading to its hypertrophy [
35]. Other pathological conditions may also occur, such as gastrointestinal disorders, GI reflux, colon and oral cancers [
36,
37]. It has been reported that some other compounds in vegetables, such as ascorbic acid, phenols and tocopherols, carotenoids, and flavonoids can prevent the formation of N-nitro compounds and have the ability to inhibit nitro substance [
26]. Based on the findings of the current study, the highest risk of pathogenicity was related to the consumption of contaminated spinach, vegetables, wheat, rice and potatoes. Watermelon, cabbage, tomato and onion were reported to have none to little risk of pathogenicity. Considering the products with the highest risk, wheat, rice, potatoes and leafy vegetables, play an important role in the human food basket. Based on the food basket for each Iranian person per day, 310 g of bread, 95 g of rice, 70 g of potatoes, 300 g of vegetables, and 280 g of fruit are considered the desirable amounts [
38].
Recently, Uddin et al. examined the nitrate levels in fruits and vegetables, and assessed the health risks. They have claimed that the pathogenicity risk of almost all samples except for radish was within the acceptable range [
39]. One study has reported the risk of THQ less than one [
40], which is inconsistent with the results of the current study. Thomson et al. [
41] assessed the risk of nitrate in foods and drinking water, and reported that the nitrate levels in vegetables, e.g., broccoli, exceeded the permissible limit and that more than half of people in New Zealand were at risk of the side effects due to high ADI intakes. In the guidelines of the Iranian National Standards, despite the lower per capita vegetable consumption compared to those in other countries, has reported that the high-risk range of nitrate in all of the popular vegetables consumed by average Iranian household is considered much lower than those of Asian, European and American countries [
15]. Based on the maximum daily absorption of nitrate per kilogram of body weight, as set by the World Health Organization [
42], consuming more than recommended limits causes nitrate-induced disorders and harmful effects on the body. It is noteworthy that this issue is more critical in children, and the amount is reduced to 62 g per day for a 25 kg child. Also, different parts of vegetables and the plants’ age can influence the nitrate level. The nitrate content in young and internal parts has been lower than the old and external parts of many products [
40].
Conclusions
This study demonstrated that the leafy vegetables contained high amounts of nitrate, which was more than the maximum limit set by the Iranian National Standards. Although the average amount of nitrate in spinach, vegetables, wheat, rice, and potatoes was permissible, it can be concluded that the risk of pathogenicity increases due to the frequency of their consumption over time. In light of the fact that nitrate is carcinogenic, the human exposure to this compound is worrisome. Considering the high contents of nitrate in some crops being above the permissible limits, the agricultural management and harvesting methods should be monitored, and effective steps taken to reduce nitrate levels in edible produce. Future research should also focus on the effects of nitrate in various populations, such as infants and children, adults over 65 years old, pregnant and lactating women, and people with different health conditions and/or diets.
Ethical Considerations
Compliance with ethical guidelines
The study did not involve human participants or animals, therefore, the ethical guidelines did not apply. The study protocol was approved by Arak University Research Council (Registration #: IR.ARAKMU.REC.1399.270).
Funding
This paper was part of a comprehensive plan to monitor the agricultural products at Arak University of Medical Sciences (No.: IR.ARAKMU.REC.1399.270). This research was supported by Deputy of Food and Drug of Arak University of Medical Science.
Author's contributions
All authors equally contributed to preparing this article.
Conflict of interest
The authors declare no conflict of interests.
Acknowledgments
The authors express their gratitude to the Research Council, Arak University of Medical Sciences for funding this research project. We also appreciate Marjaan Khatam Laboratory in Tehran, Iran, for their assistance with the experiments.
Refrences:


 , Reza Tajik2